
That’s the judgement of NASA GISS boss Gavin Schmidt, while praising her two million-year temperature reconstruction.
National Geographic reports that other scientists have backed Schmidt’s judgement, while praising her temperature reconstruction. The paper claims that the long-term committed warming from today’s CO2 levels is 5ºC (range 3-7ºC), and that if emissions double the long-term increase will be ~9ºC (range 7-13ºC). She’s talking long-term, over the next few millenia.
There are two concepts we need to get our heads around. First there is climate sensitivity, the amount of warming we get from a doubling of CO2. The second is often described as the Earth System Sensitivity (ESS), which includes the long-term effects over millenia as ice sheets, vegetation and atmospheric dust continue to respond to global warming. Schmidt has this useful diagram:
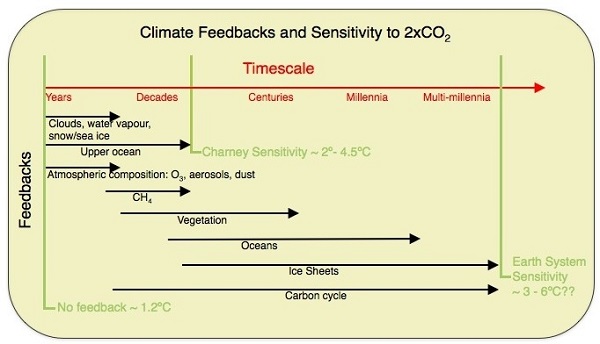
What is normally called climate sensitivity, or Charney sensitivity, is the temperature reached in the first few decades, which the IPCC puts at ~2-4.5ºC. Earth System Sensitivity (ESS) is thought to be about 4.5ºC to 6ºC according to Schmidt.
Schmidt says that whatever Snyder found in the past 2 million years, you simply can’t extrapolate as to what might happen next. There are two main reasons for this.
First, the warming and cooling we’ve had over that time was due in the first instance to changes in the earth’s orbit, the so-called Milankovitch cycles, not CO2 forcing.
Secondly, the ice sheet response we’ll get now is very different from the past response, because the huge continental sheets are now gone. Schmidt says we have only Greenland and West Antarctica in play, which is a very different ballgame. This is an image of what we had at the Last glacial Maximum, 22,000 years ago:
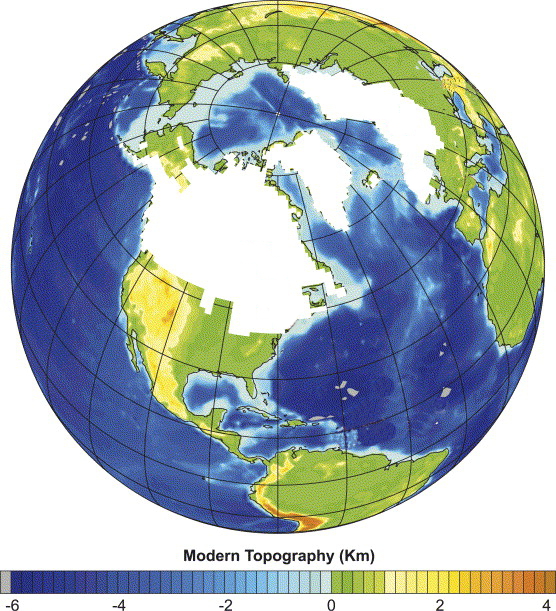
I believe there was a smaller ice sheet on Patagonia as well.
I suspect that East Antarctica will come into play, even if we don’t increase CO2 levels. However, I’d agree that the prospective conditions are very different from the past.
It is interesting that in Andrew Glickson’s paper on Snyder he quotes “other research”:
- Other research has shown that during the mid-Pliocene epoch (about 4.5 million years ago) atmospheric CO₂ levels of about 365-415ppm were associated with temperatures about 3–4°C warmer than before the Industrial Revolution. This suggests that the climate is more sensitive than we thought.
The other research is Pagani et al, where Schmidt says some unwarranted assumptions were made.
In my post Scoping long-term sea level rise I said:
- 4. 380 (360-400)ppm gives a temperature variance of 2.7 to 3.7°C and SLR of 25m (±5)
- 5. 500 (400-600)ppm gives a temperature variance of 5 to 7°C and SLR of 75m (complete deglaciation).
That was also based on ‘other research’, but not Pagani.
When you go back 4.5 million years, the Panama Isthmus is open. Across millenia the heat should distribute through the ocean pretty well, but the atmospheric systems could have been different, changing the surface temperature in the thin slither of air we live in.
For the Statement 5 I cited above, you are going back a lot further, when the continents were not where they are now, and the shape of the ocean basins may have been different, so the uncertainty is larger.
It’s by no means clear how other greenhouse gases fit into any of the above, nor can we know what effect methane clathrates will have.
The ABC reports, inter alia, Professor Jeffrey Severinghaus, from the Scripps Institution of Oceanography, saying that about two-thirds of the temperature variance comes from orbital change, so she needs to come back by a third. He could be right.
However, the bottom line is that no-one can work out how Snyder got to her conclusions from her data, and so far she hasn’t helped us. Schmidt says it’s undoable, and simply wrong, which is very definite.
Which brings us to the true value of Snyder’s research. As National Geographic says:
-
Previous research had only organized these temperature records into short snippets of history. Snyder’s critics applauded her for creating the first temperature time line that spans the globe and extends back two million years.
She cataloged and organized 20,000 reconstructions from 59 sediment cores, weighting them to build a time-line of global average surface temperatures. The sample could ideally have been larger, but it sounds fantastic coming out of a PhD project.
One of the main findings related to the so-called mid-Pleistocene transition. To create the context here’s a graph of the Cenozoic era temperatures:
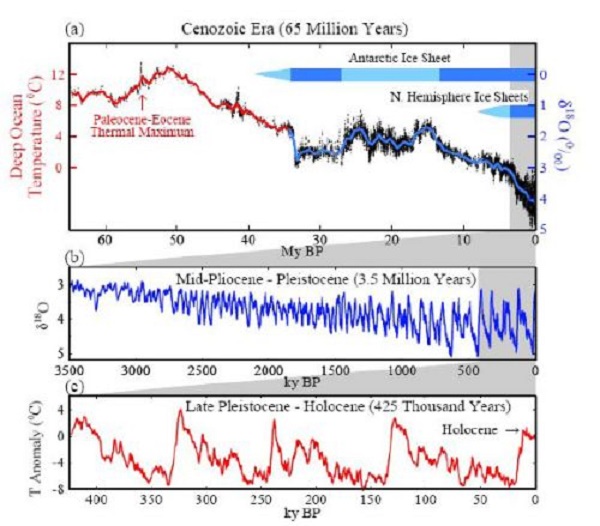
For most of the last 65 million years there has been a cooling trend. The second feature that stands out is the sharp oscillation of temperatures, in and out of what we call ice ages during the last 3.5 million years. If you expanded the graph you would find that the cycles conform with the rhythm of the obliquity, or axial tilt cycle, which occurs in 41,000-year periods.
From about 1.2 million years ago the temperature cycles lengthen and amplify, so by about 500,000 years ago they conform to the orbital eccentricity cycle, which is about 100,000 years.
Snyder found that the cooling trend had stopped before the transition, so cooling may have been a precondition of the transition, but was not the sole cause. You can see the pattern of the transition very clearly in this graph in the benthic oxide isotopes percentage:
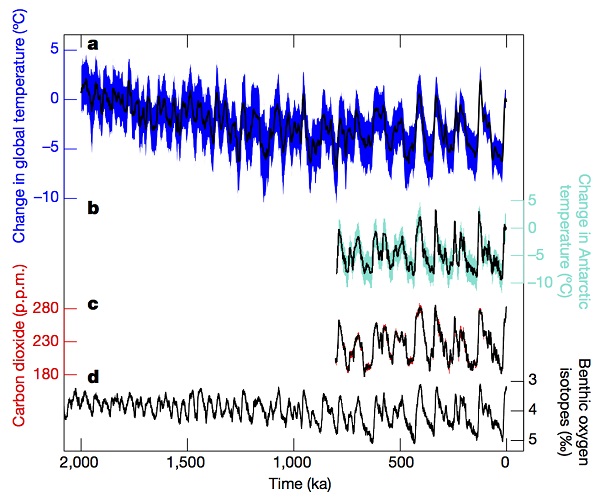
Her research shows that the 100,000 cycles were established around 900,000 years ago, and since then the Antarctic has warmed consistently by 1.6°C for every 1°C of average global warming.
And that’s about it!
Vaguely related, my younger brother, who knows stuff, told me that the official surface temperatures are taken about two metres above the ground. The ground, he tells me, can be up to 4°C hotter or colder than the official temperature.
Karl Kruszelnicki said the other day that if you take your dog for a walk, be aware that your dog is in a different climate. You may feel fine, but your pooch may be expiring from heat.
You really needed to know that!
Lots of interesting data Brian. A few comments:
Methane oxidizes air so the only times methane will be high is when volcanic activity or other activity that melts clatherates in massive amounts.
John, the post Dealing with the methane time bomb still gets hits from time to time, and is worth a read (I’ve just re-read it).
Methane in the air turns into CO2 and water over about 100 years.
Bottom line is that methane clathrates and methane in permafrost is a known unknown and still a risk, especially if the temperature goes beyond 2°C warming.
Brian: I see the permafrost as a CO2 problem rather than a CH4 problem because it will take time for the carbon in the permafrost to get into the atmosphere. This doesn’t mean that it isn’t a long term problem in that it means that future generations may have to deal with more CO2 in the atmosphere than that released by human release of fossil carbon.
On the other hand it is worth asking where the rise in atmospheric CO2 comes from during the warming parts of the earths temperature cycles. For example, if you look at the Vostok graphs it is clear that CO2 and temp move in a rough lockstep with rapid rises in during the heating phases and slow decline during the much longer cooling part of the cycle. My guess is that part of the CO2 comes from things like melting and oxidizing permafrost and drying and oxidizing peat beds, and that the cooling is slow because it takes a long time to get the carbon back into peat and permafrost.
John, two issues. On permafrost the evidence seems contradictory. If you look at the methane time bomb post from the bomb-like crater imager near the middle, some say the plant matter is chewed by microbes and CO2 is released, others find methane released. The quantities are not large, however. Archer says you’d need millions of them to make a difference.
Problem is, if we go above 2°C we are in territory we haven’t been for millions of years, and we may get millions of craters.
On Vostock I’ve manipulated in here a two-graph image I had on file:
Historically atmospheric CO2 has followed warming which emanated from the tilt angle of the earth and the way the sun strikes the NH continents at high latitude in particular. If its warmer coming out of an ice age more stuff grows and the carbon cycle expands.
I haven’t looked at how that works for a few years. There was an account of it in Hansen’s Iowa testimony, but the link is broken. I’ll have to do some research when I get time.