
 For me the main point of George Monbiot’s article about Hurricane Harvey is that the course we are currently on to achieve 3.5 to 4°C of warming by the end of the century is equivalent in magnitude to the change between the last ice age and the balmy times of the Holocene. To talk about whether this or that extreme weather event was caused by anthropogenically induced climate change seems beside the point.
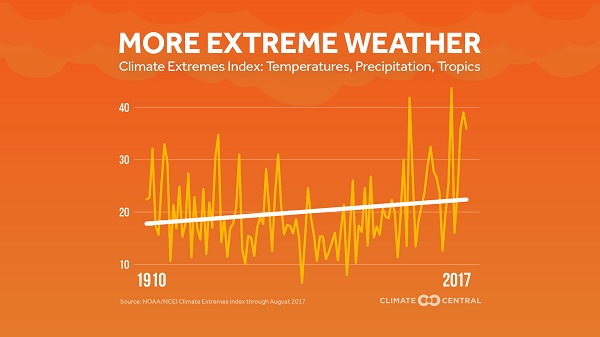
The short answer is that everything about the climate has changed, so we are experiencing a climate that is different from how it would have been, and it will change much more during the life spans of the next few generations. Generally speaking, as Climate Central’s Climate Extremes Index indicates, extreme weather events are on the increase:
Nevertheless people and journalists do look for causation in relation to individual events. Scientists who work in this area say that it is an ill-framed question. Of more relevance is how much the risks of such events have changed, and in what way such events change, usually for the worse.
To start with the IPCC view, from RealClimate, they said back in 2013 that there was little indication of a change in the number of tropical cyclones, although they are becoming more intense. In fact:
- it is likely that the global frequency of tropical cyclones will either decrease or remain essentially unchanged, concurrent with a likely increase in both global mean tropical cyclone maximum wind speed and rain rates
That ignores sea level rise and I think understates the issue a bit. In fact we are pushing the climate (upcoming post) about 10 times harder than happened in the Paleocene–Eocene Thermal Maximum (PETM) 55 million years ago, when the temperature increased 5–8 °C over around 20,000 years and stayed that way for 200,000 years. So we are in new territory in the history of the planet.
Climate Central hosts a World Weather Attribution site where attribution scientists report on specific events. They expect to complete a report on Harvey “later this fall.” Eventually we may get a report similar to the one at Carbon Brief for Hurricane Sandy where the main issue was flooding.
- Back in 1800, New York might only expect to encounter such high sea levels once every 1,200 years, whereas by 2000, the likelihood increased to about once every 400 years.
However, by 2100 such levels could be encountered once in 23 years.
So far the most useful summary on Harvey Hurricane Harvey: Connecting the dots between climate change and more extreme event from Climate Code Red by Climate Nexus using largely information from Climate Signals, where you can find all manner of information.
I’ll highlight some of what they found:
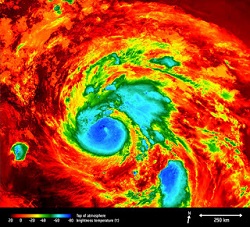
Warmth
A warmer atmosphere can hold more water, fueling extreme rainfall and increasing flood risk. Record-breaking rainfall is a classic signature of climate change.
- Houston is experiencing its third ‘500-year’ flood in 3 years.
- Since the 1950s, Houston has seen a 167 percent increase in the frequency of the most intense downpours.
Stalled weather
Research is showing that the jet stream is tending to stall in one place with accentuated curvature, bringing unusual weather which persists for some time.
- According to Michael Mann, the stalled weather pattern during Hurricane Harvey “is precisely the sort of pattern we expect because of climate change.”
Sea level rise
Harvey produced what is known as “compound flooding”. Rivers rushing toward the Gulf coast met the storm surge coming inland and water “piled up from both sides”. In Galveston, the sea surge was about 3 feet but the actual water surge was about 9 feet due to compound flooding.
Most reports emphasised that sea levels had risen by about half a foot. James Hansen says that on the US east coast and in the Gulf, sea level rise is about a foot, higher than the global average.
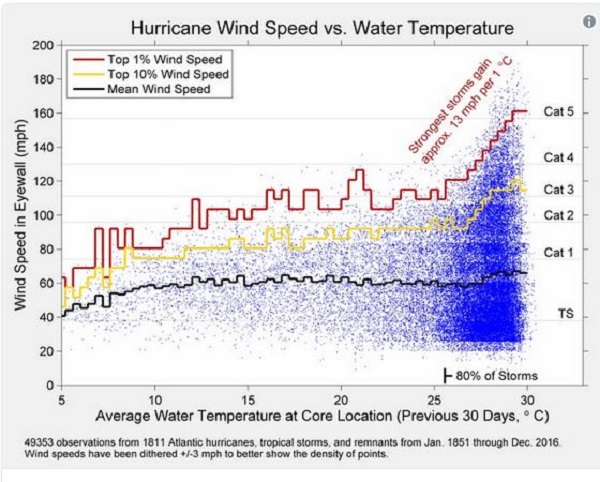
Energy
The warmer the water over which the hurricane develops the more energy is available, making hurricanes more severe.
- Harvey rapidly intensified from a regenerated tropical depression into a Category 4 hurricane in the Gulf of Mexico, aided by sea surface temperatures up to 2.7 – 7.2°F (1.5 – 4°C) above average.
Rapid intensification
- Harvey’s rapid intensification is consistent with the observed trend toward rapidly intensifying tropical cyclones, particularly in the North Atlantic and Caribbean.
Elsewhere Joanna Waters reports that Harvey was the tenth extreme weather event costing more than a billion dollars in 2017. Since then we’ve had Hurricane Irma. The trend is up, and partly because planners and politicians are allowing humans to put themselves in harm’s way by building where they shouldn’t.
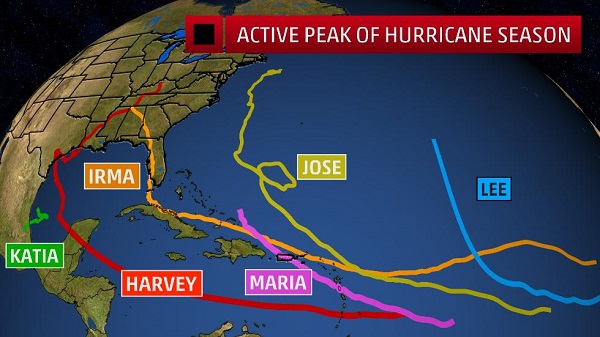
At Weather Underground it has been noted that during 30 days recently there was at least one active hurricane in the Caribbean system at all times:
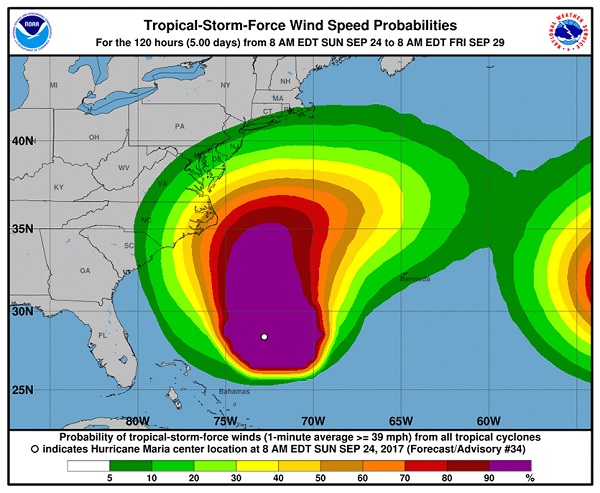
Hurricane Maria is still going, and looks as though it will brush the North Carolina Outer Banks before heading out to sea:
Angela Fritz in the Washington Post seems to think we are witnessing a step change to a new regime of hurricane intensity and frequency. Similar comments were made in 2005 after Katrina and several other severe storms.
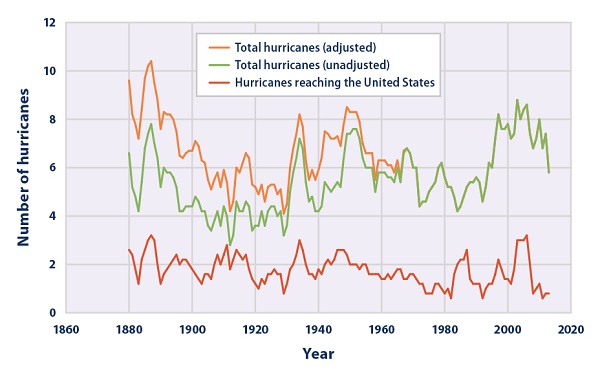
In all honesty, I think it is too early to say. Here are three graphs from the EPA, which I gather come from NOAA.
The orange line is adjusted in an attempt to account for the lack of aircraft and satellite observations in early years.
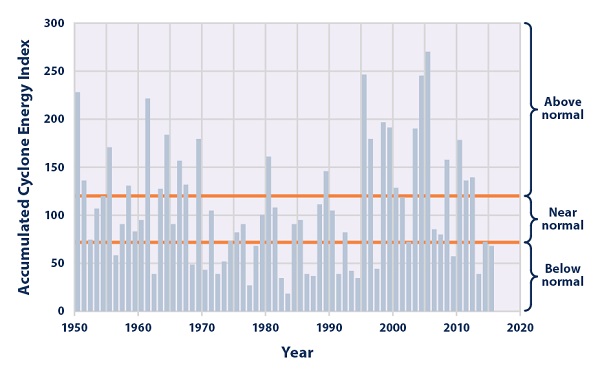
The second shows the total annual Accumulated Cyclone Energy (ACE) Index values, which account for cyclone strength, duration, and frequency, from 1950 through 2015. “Normal” is the average from 1981 to 2010.
The third shows the Power Dissipation Index (PDI), which accounts for cyclone strength, duration, and frequency, referenced against temperature.
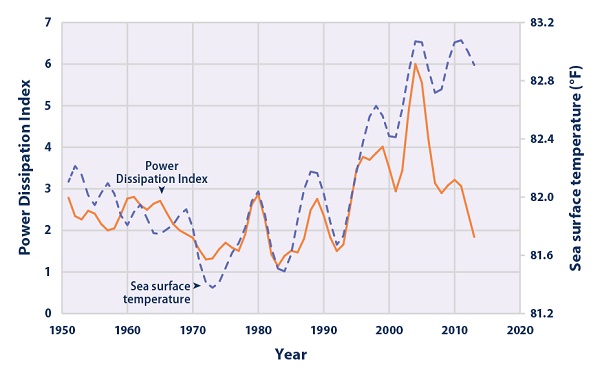
Strangely, the lines diverge in recent years.
There’s more at NOAA, with graphs that look a bit more like trending, until you read the text.
Without doubt, if 2017 data was added the graphs would look different. I’m just reminded that early this century it was so dry around that in Brisbane and elsewhere our dams nearly ran dry, which took about five dry years to achieve. Then by 2011 to 2012 we had rain like we’d never seen before. We had white water rescue in the main street of Toowoomba and from memory the Brisbane flood was a one in 2000 year event. See also Remembering the floods.
Along the way we’ve had truly awesome deluges, but 70% of Queensland is currently drought declared and some have not had rain of consequence at all since those floods six years ago.
Michael Mann was one of the first, in the Guardian, to link Harvey with climate change. Jonathon Watts has a handy summary of the links in the same paper.
They also report that Conservative groups shrug off link between tropical storm Harvey and climate change. That also includes local politicians in Texas.
Carbon Brief has a comprehensive roundup of reaction and commentary, including this graph:
I’ll leave the last word with Kevin Trenberth:
- “It’s essential to talk about climate change in relation to events like Hurricane Harvey and it’s sad a lot of reports don’t mention it in any way,” said Trenberth.
“You don’t want to overstate it but climate change is a contributor and is making storms more intense. A relatively small increase in intensity can do a tremendous amount of damage. It’s enough for thresholds to be crossed and for things to start breaking.”
And:
- “When storms start to get going, they churn up water from deeper in the ocean and this colder water can slow them down,” said Trenberth, a senior scientist at the National Center for Atmospheric Research. “But if the upwelling water is warmer, it gives them a longer lifetime and larger intensity. There is now more ocean heat deep below the surface. The Atlantic was primed for an event like this.”
I’ve added links to Toowoomba flood pics and Remembering the floods.
Brian, I don’t know where you get the time or the energy.
Thanks for another excellent summary.
The big cyclone risk may arise because ocean temperatures are rising and the cyclone zone may extend further south into areas where housing is not cyclone proof. We will also become more vulnerable to storm surges because of generally higher water levels.
Then there is world population. It is going to be harder to deal with any drop in our capacity to produce food by moving people to follow changing weather patterns. An enormous number of people already depend on the Himalayas weather patterns and the shrinking of the glaciers that help maintain water flows.
zoot, I always think what I’ve done need more work, but then I think, no-one else on the interwebs has done what I’ve just done.
Sometimes I see an old one and I think, Jeez did I do that? Then I think, I can’t do that anymore.
So thanks for the feedback. Myself I’m just someone confused trying to sort it out.
John, I believe that one metre in sea level rise means the beach retreats 100m on the average. The Dutch have got the whole thing sorted. Apparently more than half their GDP comes from below sea level.
However, in Bangla Desh the government is entirely reactive. The floods come and they try to clean up, until the next one comes.
Brian: A lot of silt flows down the rivers of Bangladesh. This will build up on the land as sea levels rise. (Water spreads more and travels slower until silt build-up catches up with sea level rise.)
Topical link
https://hackaday.com/2017/09/27/surviving-hurricanes/
Bilb: Lived in a cyclone prone mining town at one stage. The houses were more cyclone proof than Darwin and were fitted with cyclone shelters where people could retreat to if a serious cyclone was expected after cyclone Tracey.
There were cyclone procedure that we went through at the start of the cyclone season and procedures that we went through whenever a cyclone alert was on. I believe it helped.