
 A new study has found that Antarctic ice loss and sea level rise rates have tripled since 2012.
This assessment involves 84 scientists from more than 40 institutions, and combines data from 24 satellite surveys. It follows in the footsteps of the first IMBIE (Ice Sheet Mass Balance Inter-comparison Exercise) conducted in 2012, and paints a particularly grim picture of the years between then and 2017.
- The team studied changes in the ice mass of Antarctica between 1992 and 2017, and the associated contributions to the rising sea level. Before 2012, Antarctic ice was receding at a relatively steady rate of about 83.8 billion tons a year. In the years after that, the annual ice loss appears to have accelerated to a rate of 241.1 billion tons – around three times the previous rate.
This image shows the contribution to sea level rise in millimetres of West Antarctica, the Antarctic Peninsula and East Antarctica.
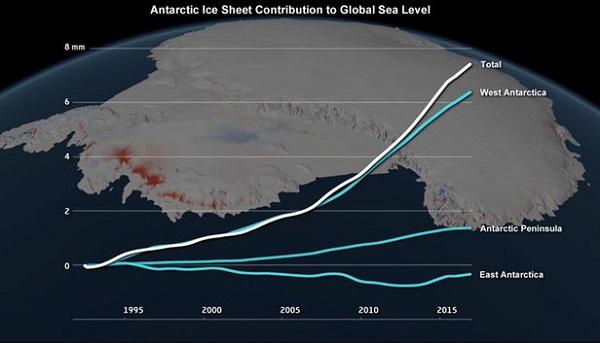
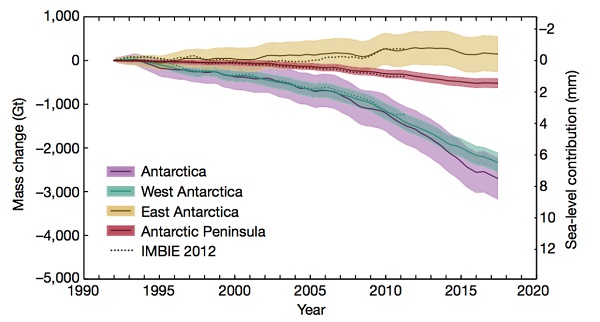
East Antarctica is actually gaining about 5.5 billion tons of ice each year on average, but on a reducing trend. It is also the least certain of the measurements. This image from Carbon Brief, which comes from the paper, shows the total amount of ice loss, together with the uncertainty bands and the results from the 2012 IMBIE:
There is more at Climate Central. The paper was published in Nature.
Implications for sea level rise
The research paper did not address the implications of the new information. Steve Rintoul, Research Team Leader, Marine & Atmospheric Research, CSIRO and Steven Chown, Professor of Biological Sciences at Monash University look at the implications for sea level rise. The Carbon Brief post also addresses implications.
Rintoul and Chown refer to a 2016 study by Robert M. DeConto and David Pollard which I posted about in Ice sheet decay spells danger from sea level rise in November 2016.
If global greenhouse emissions continue to grow as now we can look forward to 3 metres of sea level rise by 2300, from Antarctica alone, and an irreversible commitment of 5-15m in the coming millennia.
On the other hand, if GHGs peak within a decade and reduce from there, Antarctica’s contribution to sea-level rise will remain below 1 metre, which would by itself “displace millions of people and cause substantial economic hardship.”
Antarctica is also likely to be responsible for a greater share of sea level rise, which according to IPCC5 WGI Chapter 13 (2013) was broken up into the following contributing factors:
-
Thermal expansion – 1.1mm
Glaciers except Greenland and Antarctica – 0.76mm
Greenland – 0.33mm
Antarctica – 0.27mm
Land water storage – 0.38mm
Total – 2.8mm
Observed SLR – 3.2mm
Residual – 0.4mm
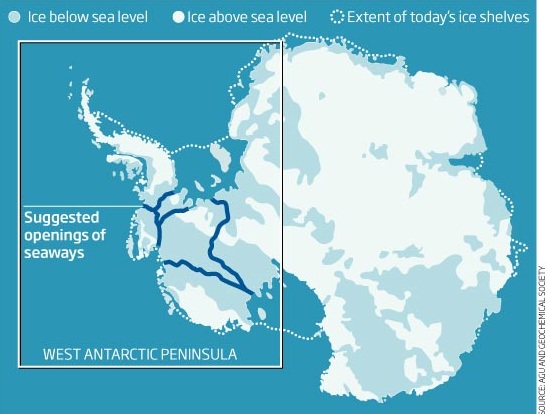
At that time the main game was thermal expansion. At some time in the current century, probably soon, ice sheet decay will be the main game. In the past six years Antarctica’s contribution has trebled from 0.2mm to 0.6mm. From my 2016 post, this image from the New Scientist shows where the sea could intrude under the ice, as well as narrow seaways that may open up across West Antarctica:
We are pushing the climate harder by many times than it has been pushed in the Cenozoic Era, that is, the last 65 million years, limiting what we can learn from the paleoclimate record, especially in the shorter term ice sheet response.
For another perspective, David Spratt and Ian Dunlop’s report What lies beneath tells us:
It is likely that the Amundsen Sea sector of the West Antarctic Ice Sheet has already been destabilized; ice retreat is unstoppable for the current conditions, and no acceleration in climate change is necessary to trigger the collapse of the rest of the West Antarctic Ice Sheet, with loss of a significant fraction on a decadal-to-century time scale. One of most significant research findings in 2014 was that the “tipping point’ has already passed for one of these “long-term” events. Scientists found that “the retreat of ice in the Amundsen Sea sector of West Antarctica was unstoppable, with major consequences – it will mean that sea levels will rise 1 metre worldwide… Its disappearance will likely trigger the collapse of the rest of the West Antarctic ice sheet, which comes with a sea-level rise of between 3–5 metres. Such an event will displace millions of people worldwide. (Emphasis added)
They were basing this on Rignot et al: Widespread, rapid grounding line retreat of Pine Island, Thwaites, Smith, and Kohler glaciers, West Antarctica, from 1992 to 2011. This map from Carbon Brief shows the location of ice sheet drainage basins in Antarctica:

Rignot et al are talking about numbers 21 and 22, which enclose the Amundsen Sea. Spratt and Dunlop also reference Pollard, DeConto and Alley (2015) Potential Antarctic Ice Sheet retreat driven by hydrofracturing and ice cliff failure, saying:
- As well, partial deglaciation of the East Antarctic ice sheet is likely for the current level of atmospheric CO2, contributing 10 metres or more of sea-level rise in the longer run, and 5 metres in the first 200 years.
Then there is Greenland, the remaining land-based ice and thermal expansion.
Rintoul and Chown assume that by 2070, 50 years time, if ambitious action is taken to limit greenhouse gas emissions Antarctica in 2070 will look much like it does today. However, some scientists believe that Antarctica has already tipped into a process of inevitable significant ice sheet decay. There is little doubt that the combined Pine Island and Thwaites glaciers, plus four neighboring glaciers, hold the key. This news.com story says:
- TWO enormous glaciers could soon irrevocably reshape our future. They’re melting. They’re fragmenting. And a cataclysmic collapse of an entire Antarctic ice sheet may be just decades away.
Complete collapse could give us 3.4 metres of sea level rise, which is serious:
- A one-metre rise in sea levels would cause frequent flooding in almost all coastal settlements. At 2m, some of the worlds biggest cities — including Shanghai and Ho Chi Minh City — would simply be swallowed by the sea.
At 3.4m, the majority of the planet’s fertile — and densely habited — coastal regions would be inundated.
That story is mainly quoting US meteorologist Eric Holthaus, which turns out to be an article in Grist, who quotes a number of glaciologists and links back to the Pollard/DeConto research. The glaciers are like a plug, if popped, as one said, it’s downhill all the way to the South Pole.
In 2014 Eric Rignot said:
- “Ice is going to retreat from this sector for decades and centuries to come, and we can’t stop it,” says Eric Rignot, a glaciologist at the University of California, Irvine, and co-author of the satellite analysis.
In December last year a huge iceberg four times the size of Manhattan broke off from the Pine Island glacier. Now UK and US scientists will lead a five-year effort to examine the stability of the mighty Thwaites Glacier:
- The UK’s Natural Environment Research Council and the US National Science Foundation are going to deploy about 100 scientists to Thwaites on a series of expeditions.
The International Thwaites Glacier Collaboration (ITGC) is the two nations’ biggest cooperative venture on the White Continent for more than 70 years – since the end of a mapping project on the Antarctic Peninsula in the late 1940s.
Grants for research totalling £20m have been awarded. Once the costs of transport and resupply to this remotest of regions is factored in, the total value of the ITGC will probably top £40m.
The huge river of ice is thinning, speeding up, and the ‘grounding line’ is retreating inland, allowing the sea water to penetrate further under the ice. This image explains:
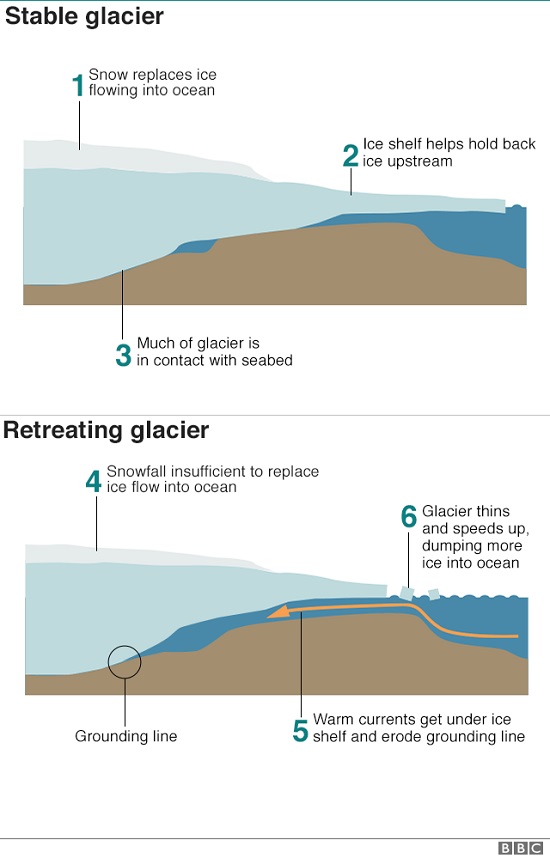
They say they need 10 years more data. However things could look very messy down there in the next 20 to 30 years.
Longer term sea level rise
Concerning the longer term, I’m not disposed to change anything I wrote in the 2015 post Scoping long-term sea level rise, where I charted these long-term relationships:
- 1. 180ppm gives a temperature of -5 or 6°C lower than now, and a sea level rise (SLR) of -120m
- 2. 280ppm gives a temperature variance of 0°C and SLR of 0m
- 3. 280-300ppm gives a temperature variance of 1.7 to 2.7°C and SLR of 5-10m
- 4. 380 (360-400)ppm gives a temperature variance of 2.7 to 3.7°C and SLR of 25m (±5)
- 5. 500 (400-600)ppm gives a temperature variance of 5 to 7°C and SLR of 75m (complete deglaciation).
Each statement assumes that emissions will be held at nominated levels for thousands of years.
The use of the 0.7 ending reflects the quantification of the term “now” for temperature in the literature. For example, the Eemian was said to be 1 to 2°C warmer than now.
Statement 3 reflects the situation in the Eemian. I’ve replaced 4-6m with 5-10m to conform with IPCC5.
Statement 4 reflects the Pliocene. Later research by Rohling et al narrowed the uncertainty range for SLR.
In Statement 5 I’ve reverted to an earlier position held by Hansen. His 425ppm does not fit with later research by Aradhna Tripati et al, who found temperatures were ~3° to 6°C warmer and sea level was 25 to 40 meters higher than at present during the Middle Miocene. Elsewhere we are told she found CO2 to be 400-450ppm at the time.
That was little changed from the original post I wrote at Larvatus Prodeo, which is no longer available, but formed the basis of this item at Greenlivingpedia which I note has been accessed 23,739 times.
Long term we are likely in deep trouble. In the next 100 years or so, there is great uncertainty. However, the recent research brings back into focus James Hansen’s notion of what sea level rise could look like if ice sheet decay doubled every 10 years:
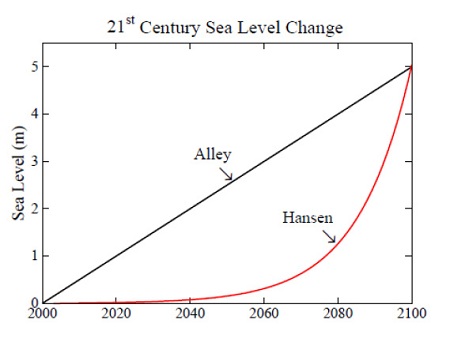
He was saying at the time that his colleagues tended to see ice sheet decay as a linear process, under which 5 metres by 2100 is not going to happen. If, however, ice sheet decay double continuously over a relatively short period, the result could be quite startling. Hansen is not saying this will happen, rather that something of the kind is possible.
Climate signals
Among multitudinous climate signals in recent years, I’ll highlight two that should impress Americans.
Hurricane Harvey was a 1 in 1000 year event, made worse by global warming, first because higher temperature yielded rainfall which was between 15 and 38 percent higher because of global warming.
Second, sea level rise increased the damage. The highest storm surge was 12.5 feet in Aransas County, that’s 3.81 metres.
Third, weather patterns tend to become stalled more often because of global warming, which happened with Harvey, multiplying the rainfall, flooding and damage.
Then here’s what happened in North Carolina during Hurricane Irene in 2011:
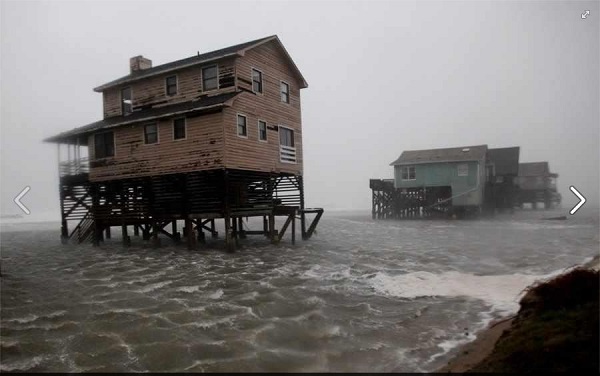
There is no room for complacency, at all.
Update: I found this Thwaites Glacier project site, with a complex diagram of what they are looking at. There is also a story and image from the Scientific American:
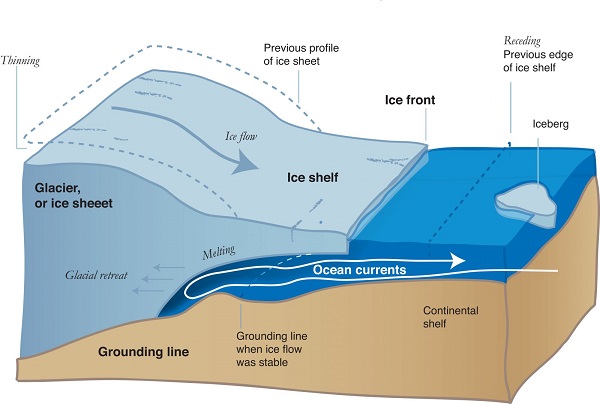
It’s a simplified version attributed to NSIDC and NASA. They really don’t know whether the warm water has chewed the grounding line over the hump, so it is all downhill to the South Pole, and how things will progress from there.
Thing is, if the water is through to the downhill slope getting zero emissions is not enough. The heat has to go out of the ocean and off the planet before the process stops.
The latest IPCC report (AR5) was published in 2014. The cut-off for research papers included in AR5 were approximately two years prior to then. That means policy decisions being made based on AR5 are now hopelessly out of date.
Geoff M, I was referring to IPCC Working Group 1 Climate Change 2013:The Physical Science Basis which was published in September 2013 and I posted about on 1 October, 2013 in
A choice of catastrophes: the IPCC budget approach.
I think the rule of thumb is that papers can be included up to about 9 months before the date of publication, which does not mean that all publications to that date will be taken into consideration.
Also the cycle from research to publication can extend over a few years.
You will see from that post and my September 2013 post Crisis or catastrophe? What will the IPCC say? that I’ve been shall we say mindful of the limitations of the IPCC process and the kind of statements they made. Unfortunately whatever is written there tends to take on biblical standards of truth until the next IPCC report.
Brian (Re: JUNE 20, 2018 AT 3:21 PM):
Unless people are deniers or “skeptics” of the science, in which case it’s dismissed/ignored entirely.
FYI, on Radio 2GB today Minister Matt Canavan says Australia’s coal is the best in the world and “those that think the coal market are dead don’t understand numbers”. He also said:
So what happens when coal, oil and gas become scarce and unaffordable? He’s also ignoring Andrew Blakers’ info.
Wonder what effect all this Antarctica melting will have on The Wind That Goes Round The World? One would think that a sea level rise of five or ten Metres shouldn’t have too much effect – but would that be a false assumption.
Wonder, too, what effects a sharp decrease in local seawater salinity will have?
In the meantime, you might do well to avoid investing in beachfront and riverside properties.
Good questions, Graham.
I found this Thwaites Glacier project site, with a complex diagram of what they are looking at. There is also a story and image from the Scientific American:
It’s a simplified version attributed to NSIDC and NASA. They really don’t know whether the warm water has chewed the grounding line over the hump, so it is all downhill to the South Pole, and how things will progress from there.
Thing is, if the water is through to the downhill slope getting zero emissions is not enough. The heat has to go out of the ocean and off the planet before the process stops.
GB: My understanding is that southern wind/weather patterns are already contracting south and reducing windfarm output in southerly parts of Australia..
My guess is that an increase in freshwater would slow the flow of warm water towards the south pole and cold water away from the pole. (The freshwater will strugle to sink.
John D, I think that is basically right. The big planet-wide thermaholine current is slowing.
However, the southern winds below the jet stream in the southern hemisphere are in a tighter circle and because there are no continents in the way are larger and more ferocious, producing more churning. I think this is bringing more warm water into contact with ice in Antarctica.
I understand the Southern Ocean is one of the main conduits for heat exchange, but under-studied.
Graham, I just found this image from an earlier post:
The tropics have expanded and the green and yellow belt is where the winds rip around Antarctica – I think.
Its all scary stuff and if that is not enough, look at: the latest update of Arctic News; there is a scientist who is looking at the changing currents in the Arctic Ocean (his article is something like “have we woken a sleeping giant”) and the possible consequences; and Paul Beckwith, a paleo climatologist has a number of Youtubes looking at the changes in the Northern Hemisphere jet streams and the new trend for jet streams to cross the equatorial wall between hemispheres.
Thanks Brian and John D, Since I asked, I caught a glimpse of something on Unprivatized TV – was it “Landline”? – about higher wind speeds on the West Coast of Tasmania causing worse bushfires.
Thanks too BilB Hearing about changes in jet streams does nothing for my tranquillity but it is much better to be informed than not..