Brian Bahnisch, a survivor from Larvatus Prodeo, founded Climate Plus as a congenial space to continue coverage of climate change and sundry other topics.
As a grandfather of more than three score years and ten, Brian is concerned about the future of the planet, and still looking for the meaning of everything.
Members of the Labor factions conspired with each other to maximise factional outcomes and then complained when they felt themselves personally short-changed.
Shorten, or any other Labor leader, is the victim, not the author, of this process. Because of the process, the Labor leader is forced to give portfolios to individuals he prefers not to have on his front bench.
Clare O’Neil was positive about the leadership election.
But the fruits of allowing members a say in the leadership run deeper than yesterday’s result. The Labor Party is buzzing. Membership has increased. Policy forums have sprung up in every direction. Policy ideas that would never normally see the light of day have been hotly debated. Critically, the ballot has been marked by civility.
This civility fell away a bit with the choice of ministers being done by factional heavies behind closed doors. Anna Burke feels women in particular did not get fair consideration admitting she was bitter and disappointed.
It seems the right did not play its part selecting only three women in its 16 choices. Eight came from the left.
Returning to Clare O’Neil’s piece, she cites Tanya Plibersek on why Labor lost the election:
As Tanya Plibersek has said, we got nine out of 10 for governing the country, but one out of 10 for governing ourselves.
Giles Parkinson at RenewEconomy tolls the bell for fossil fuel energy producers pretty much on a daily basis. Recently he posted that Energex’ business model was broken, according to its annual report.
To explain the set-up, Energex is the state-owned electricity wholesaler and distributor for South East Queensland. It doesn’t generate power or retail power to the customers. It services 1.3 residences and other customers in an area with a population of 3.1 million:
Power is generated by power stations and delivered to Energex through a high-voltage transmission network that is owned and operated by Powerlink Queensland, also a government owned corporation. Go here for brief industry structure. The network that delivers power to residences and other customers is owned and operated by Energex.
In our house we buy power from AGL. I’m not sure they do anything other than send us a bill. They probably outsource their metre reading. Certainly they outsource marketing as became clear when I asked a question of a sales representative.
Ergon Energy, also state-owned, is the equivalent company for the rest of the State. Actually it is a cluster of operating companies with several joint ventures, including SPARQ Solutions Pty Ltd, which provides information and communications technology (ICT) solutions and services to both Ergon and Energex. Ergon owns and operates 33 stand-alone power stations in remote off-grid locations selling directly to customers. The shaded area on this map shows the extent of the grid: Continue reading Queensland power generation at the crossroads→
There is a bit of a meme around that the MSM are giving the LNP Coalition a free ride in government. On Friday the Australia Financial Review did its bit to buck the trend by asking the above question in an editorial.
When federal Industry Minister Ian Macfarlane spoke about a “final” assistance package for GM Holden last week, The Australian Financial Review took it as a sign that someone was finally standing up to the car makers’ protection racket. But Mr Macfarlane’s latest comments indicate a more protectionist mind-set. He agreed that Australia “needs” a car industry. He wants to reverse Ford’s decision to cease manufacturing cars in Australia after 2016. He wants an Australian industry to make cars that are driven “all over the world”. And he flags the option of an Australian car industry that is “supported by the government long term”. “I’m going to do everything I can to work with the companies to make sure that car workers’ jobs are protected, so we can have an industry long-term, so that Australia can be proud of its industry base,” he said on Thursday.
Then:
Has this normally sensible minister gone mad? It’s one thing to politically show you are doing everything you reasonably can to keep an industry going. But it’s another to use the language of the mendicants and rent seekers…
The AFR says that putting uncompetitive industries on permanent subsidy mocks Tony Abbott’s vow to make Australia open for business. It says that Joe Hockey and company should stand up to this lunacy.
At stake is whether the Abbott government has the wit and gumption to tackle the serious task of reviving Australia’s stalled productivity growth. Mr Macfarlane should be the first person to recognise this.
In Part 2 of the round-up of commentary on the IPCC WG1 report I’ve tried to highlight where people have said something new or not emphasised elsewhere. I’ve not attempted to cover the MSM.
That’s it as a round-up. I plan to revisit particular topics later when the IPCC have finished fiddling with the text and layout.
The following image is the temperature projections representing the most optimistic and pessimistic scenarios. Bear in mind that RCP2.6 is probably hopelessly optimistic and at present we are tracking to do worse than RCP8.5. Also what happens is not likely to be as smooth as the graphs the models spit out.
Not entirely, is the answer given, but the text really says, yes, we can be sure. Anything that can’t be well-measured, such as the leaking of methane from permafrost, has been set aside. Also impacts with low probability and higher threat. So the report is restricted to the well-understood knowns and thereby conservative.
Science writer Michael Le Page distils a 10-word bottom line: we have to leave most fossil fuels in the ground.
He points to Norway to illustrate the problem. They get nearly 60% of their electricity from renewable sources and plan to go carbon neutral by as early as 2030. But they will do this by buying carbon credits with the earnings of their fossil fuel exports.
Doug Craig at Climate of Changepicks up on the theme. Energy companies are currently spending $600 billion trying to find more fossil fuels.
This is a wrap of some of commentary on the recent IPCC report. You can follow the links, or not, according to your needs, time and desires.
Climate Code Red carries a very clear summary of the report, which they got from Climate News Network, a handy site I wasn’t aware of.
The summary covers elements I neglected, such as Evaluation of Climate Models, but doesn’t go into the climate budget approach.
The post includes links to other commentary.
At RealClimate Stefan Rahmstorf solves the problem of the graph showing 82cm as the upper limit of sea level rise compares with 98cm in the text. It’s the last decade, the difference between 2080-2100 and 2100! Under RCP8.0 SLR will be accelerating rapidly according to forecasts.
What the report describes, in its dry, meticulous language, is the collapse of the benign climate in which humans evolved and have prospered, and the loss of the conditions upon which many other lifeforms depend. Climate change and global warming are inadequate terms for what it reveals. The story it tells is of climate breakdown.
We need to leave most of the fossil fuel reserves everywhere, but for the corporations it’s full steam ahead, supported by their governments.
At ABC Environment Michael Mann and Dana Nuccitelli are in no doubt as to what’s causing global warming. The IPCC report:
concludes that humans have caused at least 50 per cent and most likely 100 per cent of the global warming over the past six decades, with external natural factors like the sun and internal natural variation like ocean cycles each contributing approximately zero to the warming during that time.
Ryan Koronowski at Climate Progress tells us 15 things we need to know about the report. For one thing Obama’s top science advisor said the report “represents the most comprehensive and authoritative synthesis of scientific knowledge about global climate change ever generated.”
And Stanford scientists Noah Diffenbaugh and Chris Field find that the current pace of warming is happening 10 times faster than any time over the last 65 million years.
Below I’ve set set out some of the main findings in the Summary for Policymakers (downloadable from here) from the IPCC’s Climate Change 2013: The Physical Science Basis before looking at what they say about the wriggle room remaining to us (ie. the ‘climate budget approach’) if we want to avoid dangerous climate change.
In this report they’ve set up a reference pattern which will be followed unless otherwise specified in the remaining volumes, so we’d better wrap our minds around it.
The basic concept is that of Representative Concentration Pathways (RCPs) which are expressed in terms of watts per square metre of radiative forcing (W m-2). So when looking at phenomena such as future temperature change or sea level rise there is no ‘business as usual’ (BAU) scenario. Four scenarios have been chosen – RCP2.6, RCP4.5, RCP6.0 and RCP8.5. These are described as, respectively, a mitigation scenario leading to a very low forcing level, two stabilisation scenarios and one scenario with very high greenhouse gas emissions. The last (RCP8.5) is perhaps the equivalent of BAU or a ‘no climate change policy’ scenario.
AR5 uses four time reference points, two past and two future – 1850-1900, 1986-2006, 2046-2065 and 2081-2100.
I have called 1850-1900 ‘pre-industrial’, while 1986-2005 is roughly ‘now’. It needs to be borne in mind that the 0.61C warming had already taken place from pre industrial times to 1986-2005. Looking forward 2046-2065 is ‘mid-century’ while 2080-2100 is roughly the end of the 21st century.
I’ve prepared a spreadsheet showing in the first column the prospective temperature rise from ‘now’ to the end of the 21st century. The second column adds in the warming from pre-industrial until ‘now’. Finally I’ve tabulated the increase from pre-industrial to mid-century. I’ve only quoted the mean values so that the signal doesn’t get lost in the noise.
Figure 1: RCP temperature scenarios
I’ve used green to indicate a comparatively ‘safe’ climate, orange to indicate the increasingly contested zone which clearly carries some danger, and red to indicate breaching the 2C guardrail which everyone with half a brain accepts as dangerous.
What needs to be emphasised here is the non-linearity of climate vulnerability and risk. As temperatures increase the potential for nasty surprises or ‘tipping points’ increases, but frankly we are already entering that zone.
Some points to note here. Firstly, the change from 1880 to 2012 (the real ‘now’) is given as 0.85C (0.65 to 1.06 with 90% certainty).
Secondly, while the CO2 levels are linked to certain watts per square metre in the RCPs the CO2 levels stand as a marker for all greenhouse gases. The RCPs don’t change if you additionally identify the MH4 and NO levels, as they are already included in the calculations.
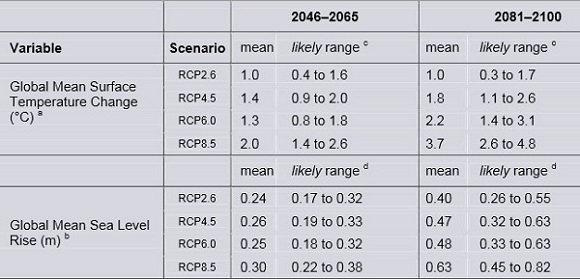
This table from the report shows the forecast temperatures, plus sea level rise, with uncertainty ranges.
Table 2: RCP scenarios for temperature and sea level rise___
The uncertainty range is a bit narrower than it was in AR4 in 2007. Please note, the text actually gives the range for RCP8.5 as 0.52 to 0.98m.
If we discard RCP2.6 because it won’t happen the total range of prospective sea level rise is 32cm to 82cm, with medium confidence. A linear extrapolation of the current rate of 3.2mm pa will yield the lower bound of that range. Also we are told:
Confidence in projections of global mean sea level rise has increased since the AR4 because of the improved physical understanding of the components of sea level, the improved agreement of process-based models with observations, and the inclusion of ice-sheet dynamical changes.
Furthermore:
Based on current understanding, only the collapse of marine-based sectors of the Antarctic ice sheet, if initiated, could cause global mean sea level to rise substantially above the likely range during the 21st century. However, there is medium confidence that this additional contribution would not exceed several tenths of a meter of sea level rise during the 21st century.
Under RCP8.5, however, the annual rate of change by 2100 will be from 8mm to 16mm, with a mean nearly four times the current rate. Apart from RCP2.6 sea level rise will continue in subsequent centuries.
RenewEconomy has a simple summary of the report, which includes this on precipitation:
Changes in the global water cycle in response to the warming over the 21st century will not be uniform. The contrast in precipitation between wet and dry regions and between wet and dry seasons will increase, although there may be regional exceptions.
Evidence for human influence has strengthened since AR4. It is now considered extremely likely (formerly very likely) that human influence has been the dominant cause of the observed warming since the mid-20th century. Moreover,
There is high confidence that changes in total solar irradiance have not contributed to the increase in global mean surface temperature over the period 1986 to 2008, based on direct satellite measurements of total solar irradiance.
Here’s the graph of radiative forcing:
Figure 1: Radiative forcing drivers___
Here’s the historic graph for temperature rise, showing clearly that warming is still occurring:
Figure 2: Land and ocean surface temperature anomaly 1850-2012
Crisis or catastrophe – the climate budget crunch
Generally speaking, the 4C limit is said to be the point at which civilisation as we know it is threatened. Of relevance here, the AR5 document tells us that the near-complete melting of the Greenland ice sheet will occur, over a millennium or more, with a temperature rise of somewhere between 1C and 4C relative to pre-industrial.
The report still uses the guardrail of 2C temperature rise relative to 1861-1880 (Figure 2 shows that this would be similar to 1850-1900) in order to mark dangerous climate change. You’ll get plenty arguments about that. Bolivia, for example, wants to use 1C as the limit for a safe climate. In this post I noted that some developing countries sought a lower guardrail of 1.5C rather than 2C while the African civil society group Pan African Climate Justice Alliance (PACJA) wanted 1 to 1.5C.
David Spratt asks the question as to whether current levels of CO2 are already dangerous. His answer is unsettling, to say the least. What do our politicians think of the notion that we need to keep the temperature rise to less than 1.5C if we want to preserve more than 10% of corals worldwide?
He also found that during the Eemian 120,000 years ago we had three metres of sea level rise within 50 years with much gentler forcing than we have now, in probably the best analogue of what lies before us.
In a warming world what matters is the total quantum of CO2 in the atmosphere. The ‘climate budget approach’ identifies the total anthropogenic CO2 emitted to cause warming of 2C. For a 66% chance of staying under 2C the total CO2 emitted must not exceed 1000Gt, according to calculations done by Malte Meinshausen and others back in 2009. The later we leave cutting the harder we have to cut. Meinshausen’s article in Nature is paywalled, but this graph in an article by Stefan Rahmstorf (in German) gives the idea:
Rahmstorf’s text talks about 1000Gt of CO2 or about 1500GT of CO2 equivalent with other greenhouse gases for a 25% chance of staying within 2C. Forget the precise figures, it’s the pattern of peaking and subsequent reductions that matter.
Now, as Giles Parkinson reports, the carbon budget figures have taken a haircut to become 800Gt for a 66% chance of 2C when “accounting for non-CO2 forcings”. Problem is we’d already used up 543Gt of the budget by 2011.
Fiona Harvey at The Guardian tells us that the decision to put the numbers in the report was hard-won. There was concern they “would have political repercussions”. I think that was the intention!
Oliver Milman also at The Guardian, tells us that cuts of 10% per annum will now be necessary, though I can’t find that in the report. He doesn’t say from when. This graph, from the Climate Commission’s 2011 The Critical Decade report (the site is now down the crapper – my summary is here), shows 9% pa from 2020 for a 66% chance.
Figure 4: Emissions reduction options
I suspect the new 10% is from 2015 or 2017.
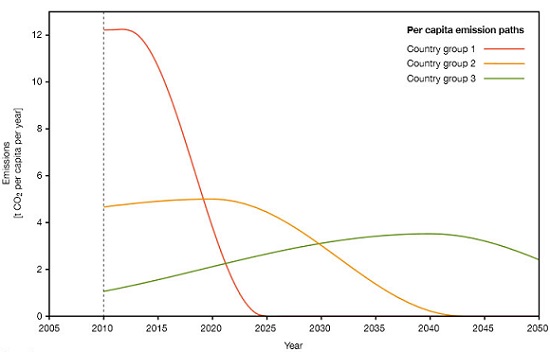
The above graph is sourced from a substantial 2009 document (in German) produced by WBGU (The German Advisory Council on Global Change) making the case for a carbon budget approach. Of more use to us is their English summary which on page 5 outlines the steps to be taken to provide an equitable way forward. The high polluting countries should take urgent steps to reduce emissions. Developing countries are then given space to increase emissions before reducing. The strategy is captured in this graph:
Figure 5: The climate budget approach
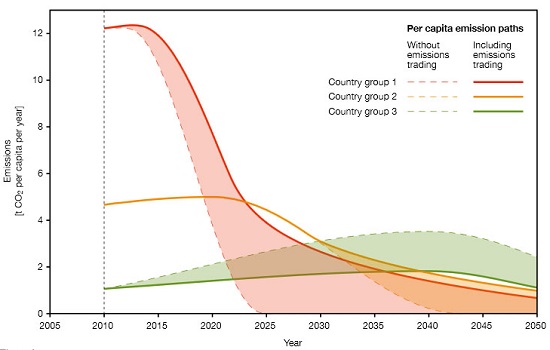
The red line represents the industrialised countries, green the developing countries. Newly industrialising countries such as China, Thailand and Mexico are represented by orange. With world-wide carbon trading (a world climate bank is proposed) the pattern would be varied along these lines:
Figure 6: The carbon budget approach with carbon trading
By 2100 all countries are allowed the same per capita emissions.
There is no doubt at all that the Germans and possibly the Europeans hoped for a deal along these lines from the UNFCCC meeting in Copenhagen in 2009. In the end a weak ‘contribute what suits you’ deal was cooked up in a small unofficial meeting that took place when President Obama went looking for his Chinese counterpart and found him ensconced with the leaders of India, Brazil, South Africa and others. The Europeans were not in the room. To say they were pissed off is an understatement. Nor was our man Rudd in the room, one of three leaders appointed to assist the Danish chair.
Now we have a deal to conclude a deal by 2015 within the UNFCCC framework, to be implemented from 2020. We’ve lost five years and the task is immensely harder.
Parkinson notes that our skinny remaining carbon budget means we can only afford to use about 10% of the world’s known fossil fuel reserves. But there is $4 trillion of shareholder value tied up in 200 listed companies in the industry carrying $1.5 trillion in loans. Writing down the value of that lot could break a few banks deemed too big to fail.
We’ve got a crisis for sure and a choice between two catastrophes.
It will be interesting to see what the mitigation working group comes up with. For my money, whatever they propose the Americans and the Chinese will not be pinned down to anything binding. In both cases their internal politics will not allow it.
The full WG1 report is now available. It’s 2126 pages long and they ask you not to quote it yet.
This was a repost and update of one I did in May 2009, Climate crunch which linked to a special edition of Nature where I think an early version of the Potsdam climate budget approach was outlined.
The post Suffer the little children told the story of what happened in Copenhagen and beyond.
In sum, the dynamics of the global coupled human-environmental system within the dominant culture precludes management for stable, sustainable pathways and promotes instability.
The quote was actually from the abstract of a sober, technical paper by geophysicist Brad Werner. The IPCC Fifth Assessment Report will also be sober and technical, based on peer reviewed literature, at least accepted for publication two to three months before the draft of each section is finalised, plus ‘grey’ material, which I take it means reliable sources such as government reports and reports prepared by or for organisations such as the International Energy Association, the World bank and our erstwhile Climate Commission.
There will be three working group reports, each with a summary for policymakers, plus a synthesis report. The working groups are:
WG1: The Physical Science Basis
WG2: Impacts, Adaptation and Vulnerability
WG3: Mitigation of Climate Change
It remains to be seen how urgent and dramatic the summaries for policymakers will be. The full import won’t be on view until the publication of WG3 in April next year, but the first should give us an idea of the seriousness of the situation.
These posts are intended to share information and ideas about climate change and hence act as a roundtable. Again I do not want to spend time in comments rehashing whether human activity causes climate change.
This edition is mostly about the doings of our new government, prospective EU targets, a statement by religious leaders and a couple of items on health implications.
1. Greg Hunt’s role diminished
Whether or not Greg Hunt gets to go to the UNFCCC (UN Framework Convention on Climate Change) Conference of Parties (COP) in Warsaw from 11 to 22 November. Julie Bishop will henceforth be the lead negotiator in international climate talks.
The story in the AFR says Hunt has been “stripped of responsibility for global climate change negotiations”. He still gets to go and hang out at the talks. One might say that Australia’s representation has been upgraded. Suspicious minds might also think that Hunt couldn’t be trusted. He actually believes human activity causes global warming and might join the warmist urgers if not kept on a tight leash. Continue reading Climate clippings 84→
The summer melt of the Arctic appears to have reached it’s limit with the sea ice extent at 5.1 million km2 (cf. the 3.41 million km2 record in 2012) as shown on this graph from the NSIDC’s Arctic Sea Ice News and Analysis site:
On Thursday the Abbott government took four actions on climate change. First, Greg Hunt phoned Tim Flannery, letter to follow, that the Climate Commission was to cease operation. We can take for granted that money was not the problem. Five million over four years in a $400 billion pa budget is not even small change.
“We will be a problem-solving government based on values, not ideology,” the new Prime Minister added.
So what problem were they solving? Too much information on climate change? Is information from independent scientific sources too inconvenient? We are told that the information we need will be prepared by the public service in the future, where there will no longer be a dedicated department for climate change.
Lenore Taylor thinks the sacking of senior public servants smacks of ideology, not values. She says two of them, Martin Parkinson and Blair Comley, appear to have been punished because of their roles in implementing the former government’s policy on climate change.
The other three actions require legislation – getting rid of the ‘carbon tax’, shutting down the Climate Change Authority and the Clean Energy Finance Corporation. So all the Government can do now is commence preparing legislation. Continue reading Abbott’s direct action on climate→
These posts are intended to share information and ideas about climate change and hence act as an open thread. Again I do not want to spend time in comments rehashing whether human activity causes climate change.
This edition contains items, exclusively, I think, in climate science and impacts. The thread is meant to function also as a roundtable to share information and ideas.
1. Climate change picked the crops we eat today
The New Scientist carries a story about how some cereals we know today were changed by the climate as we came out of the last ice age. Researchers at the University of Sheffield, UK took seeds of precursors of modern wheat and barley found with human remains in a 23,000-year-old archaeological site in Israel. They grew these together with four wild grass species that aren’t eaten today, but were also known to grow in the region at that time, and grew them under conditions replicating levels of CO2 then and also the higher levels when farming first arose 10,000 years ago.
All the plants grew larger under the higher levels of CO2, but the relatives of wheat and barley grew twice as large and produced double the seeds. This suggests the species are especially sensitive to high levels of CO2, making them the best choice for cultivation after the last ice age.
The team plan to look at whether other food staples around the world are similarly affected by elevated CO2 levels, for example millet grown in Asia and maize in North America. They also plan to compare the effects of CO2 on legumes such as peas. Continue reading Climate clippings 83→
Climate change, sustainability, plus sundry other stuff

 Returning to Clare O’Neil’s piece, she cites Tanya Plibersek on why Labor lost the election:


 These posts are intended to share information and ideas about climate change and hence act as a roundtable.
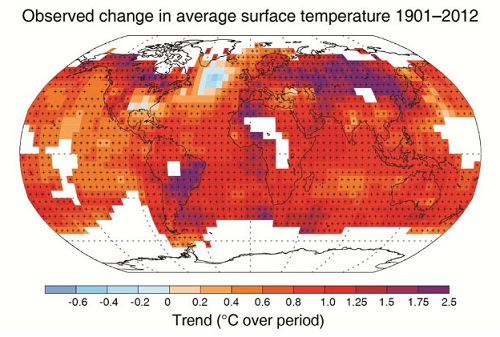
 Below I’ve set set out some of the main findings in the Summary for Policymakers (downloadable from
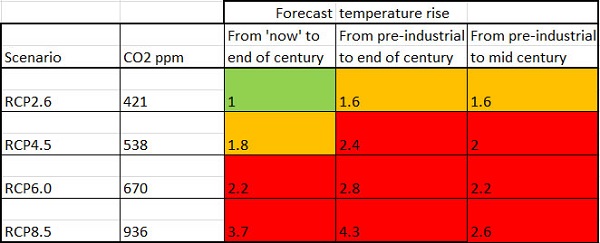


 These posts are intended to share information and ideas about climate change and hence act as a roundtable. Again I do not want to spend time in comments rehashing whether human activity causes climate change.