
The numbers are in for 2020.
Remember Greta Thunberg, the girl who can’t quit, said:
- The emissions are increasing and that is the only thing that matters.
In September 2019 I posted the Four graphs that matter in the climate emergency with some bonus graphs. I’ve decided that we should be watching sea level rise also, because of the future destruction it will wreak, and because sea level rise was the chief motivation behind the move from the island states to target 1.5°C of warming rather than 2°C.
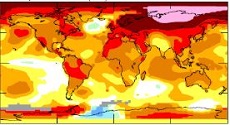
The big news, however, is that 2020 was basically tied with 2016 as the warmest year ever, which is now reckoned to be 1.25°C or more above pre-industrial, depending on where you start. Continue reading Five climate graphs that matter: 2020