 This edition looks at changes in the cryosphere, a major US report, the prospects for an El Niño and the problem of China burning coal.
1. Pacific Ocean hot spot
Scientists have discovered a hot spot in the Pacific Ocean which is partly responsible for global warming in the Arctic. Incredibly this hot spot is east of Papua New Guinea.
This phenomenon is attributed to natural variations rather than global warming. Therein, perhaps, lies the reason that scientists have been constantly surprised by the rapidity of the Arctic sea ice loss.
2. Southern Ocean winds strengthening and moving south
Scientists have confirmed in a study covering the last 1000 years that winds are strengthening in the Southern Ocean and moving south. They found a definite trend greater than can be explained by natural variability and attributable to the effect of increased greenhouse gases.
Hence the drying of southern Australia is expected to continue. Also the tightening of winds around Antarctica inhibits warming of the continent. Nevertheless the warming of West Antarctica is considerable.
3. Antarctic glaciers melting past point of no return
A group of melting glaciers in West Antarctica appears to have reached the point of no return according to scientists from NASA and the University of California Irvine. Even if we cut back greenhouse gas emissions savagely now the melting will continue. We are probably looking at 3 to 5 metres of sea level rise, from Antarctica alone – that is our gift to future generations. Dangerous climate change is no longer just a future possibility, it’s happening now!
The question is, how long will it take? Here there is uncertainty. It could be as short as two centuries or as long as nine. Professor Eric Rignot thinks two centuries is “not outrageous”.
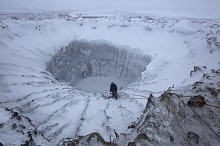
4. East Antarctica more vulnerable than thought
Part of East Antarctica is more vulnerable than expected to a thaw that could trigger an unstoppable slide of ice into the ocean and raise world sea levels for thousands of years, a study showed on Sunday.
The Wilkes Basin in East Antarctica, stretching more than 1,000 km (600 miles) inland, has enough ice to raise sea levels by 3 to 4 meters (10-13 feet) if it were to melt as an effect of global warming, the report said.
The Wilkes is vulnerable because it is held in place by a small rim of ice, resting on bedrock below sea level by the coast of the frozen continent. That “ice plug” might melt away in coming centuries if ocean waters warm up.
“East Antarctica’s Wilkes Basin is like a bottle on a slant. Once uncorked, it empties out,” Matthias Mengel of the Potsdam Institute for Climate Impact Research, lead author of the study in the journal Nature Climate Change, said in a statement.
Wilkes basin could be more vulnerable than West Antarctica, but perhaps on longer time scales. Again there is concern with tipping points. James Hansen famously said, You can’t sling a rope around an ice sheet!
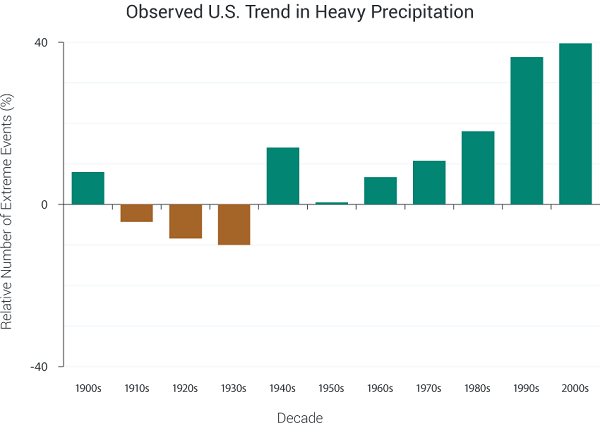
5. Climate change is clear and present danger, says landmark US report
Climate change is already severely impacting US economy, ecology and health, according to the the third National Climate Assessment report. Arid areas will become dryer, moist areas wetter and wildfires and storms will become more frequent and severe. For example floods have increased in frequency, mainly in the Midwest and Northeast:
From The Guardian:
Climate change has moved from distant threat to present-day danger and no American will be left unscathed, according to a landmark report due to be unveiled on Tuesday.
The National Climate Assessment, a 1,300-page report compiled by 300 leading scientists and experts, is meant to be the definitive account of the effects of climate change on the US. It will be formally released at a White House event and is expected to drive the remaining two years of Barack Obama’s environmental agenda.
The findings are expected to guide Obama as he rolls out the next and most ambitious phase of his climate change plan in June – a proposal to cut emissions from the current generation of power plants, America’s largest single source of carbon pollution.
Joe Romm at Climate Progress has more, while Emily Atkin looks at the impact on indigenous groups in Alaska and Pacific Islands.
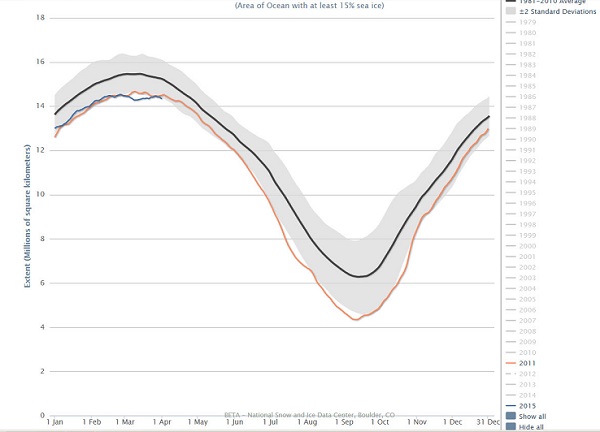
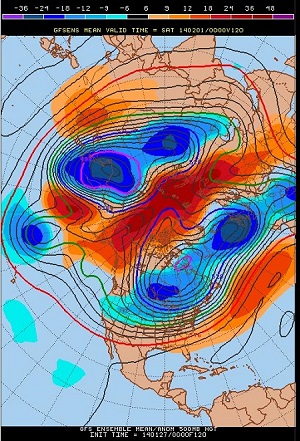
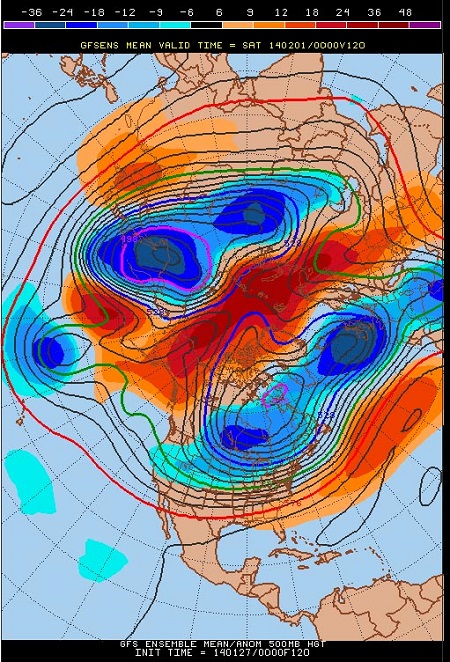
6. Chances of El Niño almost 4 out of 5
The chances of an El Niño developing this year are now at almost 80% according to some estimates. This graph shows the increased temperature in El Niño years.
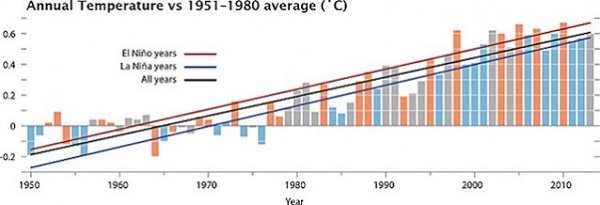
It could be a warm one.
Parts of the western United States suffering chronic drought could have flooding rains. In Oz where large areas are in drought, there would be even less chance of relief.
7. China, please stop using coal!
China should put a cap on greenhouse gas emissions from coal by 2020, and then swiftly reduce its dependency on the fossil fuel, according to a new study. Otherwise climate change will be impossible to stop.
Of relevance, back in 2011 the IEA said that after 2017 any new fossil fuel power generation should be matched by the decommissioning of equivalent existing capacity.
Reminder: Use this thread as an open thread on climate change.

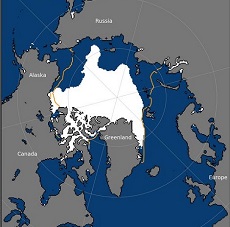 Arctic summer sea ice minimum was the sixth lowest on record. So we can all relax, right?
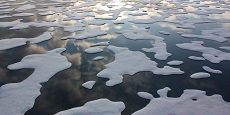

 As
As 
 These posts are intended to share information and ideas about climate change and hence act as a roundtable.
 Meanwhile I’ll try to keep some information flowing on climate change. Both these projects may be of more use than any contribution I can make to an election here in Oz. This time CC will be free flow rather than numbered items, to save time. I’ll use bold to identify the topics.
 These posts are intended to share information and ideas about climate change and hence act as an open thread. This post has emphasised science, observations and impacts. Comments, about science, observations impacts, and future predictions are welcome. I do not, however, want a rehash of whether human activity causes climate change.