
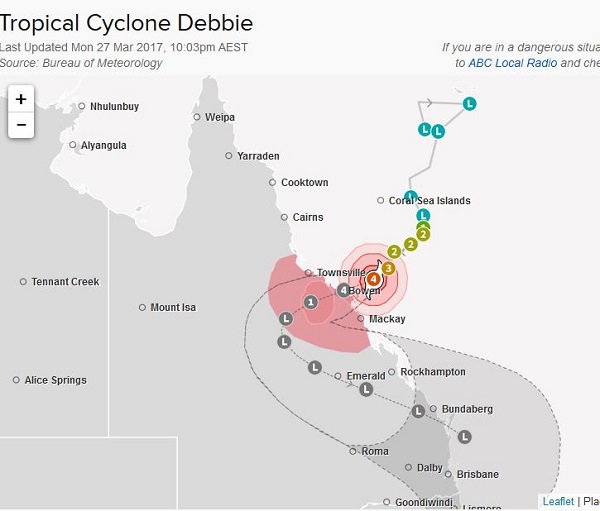
At time of writing, cyclone Debbie is looming to make landfall at Bowen, south of Townsville on the Queensland coast:
Tag Archives: climate impacts
Climate clippings 99
This edition is somewhat themed around climate policy and planning in China, the US and Australia. It also includes items on puffins in Maine, the Lowy Institute poll and the warm weather we’ve been having in May.
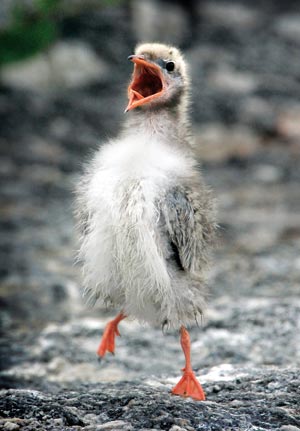
1. Petey Puffin dies on camera
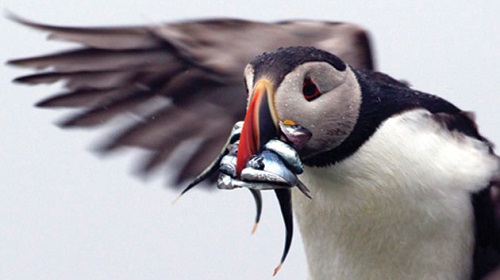
Puffins were once common on the coast off Maine but were eliminated by overhunting. In recent years there has been a project to repopulate the area, which was proceeding well accompanied by a cam project where children around the world could watch the birds in their habitat. Petey Puffin, a chick being fed by its parents became a popular focus. The only problem was that the parent birds kept bringing him butterfish which were just too large for him to swallow. This went on day after day until the chick died on camera.
The project co-ordinator then checked the 64 other burrows being monitored to find that only 30% of chicks survived.
Problem was that hake and herring normally abundant around Maine had moved north as the water warmed to be replaced by butterfish.
The warmer water brought many other changes to the waters off Maine.
Incidents such as these remind people that they are living in the midst of climate change.
2. President Obama gets serious on climate change
From John Abraham at Climate Consensus – the 97%:
President Obama just announced a major effort to reduce global-warming gases from United States power plants. These new rules, and his prior strong actions on climate change, signify a major shift for the United States. No longer is the U.S. the world laggard on dealing with climate change – we are quickly becoming the leader.
We finally have a president that understands science. We finally have a president that honestly includes scientists as decision makers – rather than effectively muzzle them. We finally have a president that recognizes the social and economic costs of climate change. We finally have a president who is charting a pathway that may lead us to bend the curve of emissions downward so that the most serious climate change consequences are avoided.
Most importantly, we finally have a president who is a world leader.
3. Not everyone is happy
John Podesta before rejoining the White House inner circle in an interview said history will not applaud the measures taken by Obama as it fails to meet what the science demands. It won’t limit us to a 2°C temperature rise, and 2°C is too dangerous.
A 30% reduction by 2030 from 2005 levels shrinks to 7.7% if you use the international baseline of 1990. Moreover, coal will be replaced by gas, where the ‘fugitive’ methane emissions are not counted.
Podesta says that in Obama’s first term his top aides never took climate change seriously. Ironically, Podesta as Obama’s transition director in 2008 helped select those aides.
4. China to cap emission
China will seek to cap fossil fuel emissions for the first time, we are told.
Reading carefully it seems that emissions will still grow, but not as fast as business as usual.
Pointing out that there are 1.6 billion people in the US and China, Amanda McKenzie CEO of Climate Council thinks the decisions are a game changer.
5. Time for Tony Abbott to admit his climate policy is crap
In case you missed it, that is Giles Parkinson’s advice to Abbott.
Parkinson says Australia should be embarrassed by its lack of action compared to the United States and China, which has indicated it will place a cap on its emissions as soon as 2016.
Ironically, Abbott could have a pretty good collection of climate and renewable energy policies just by doing nothing. Everything Labor put in place is still there, apart from Tim Flannery and the Climate Commission, which has morphed into the Climate Council with private money and public donations.
6. Lowy poll
The Lowy Institute Poll 2014 is now available.
The number of Australians now saying global warming is a “serious and pressing problem” and that “we should begin taking steps now even if this involves significant costs” is now 45%.
Some 38% now say the the problem of global warming should be addressed, but its effects will be gradual, so we can deal with the problem gradually by taking steps that are low in cost. 15% think we should leave it until we are sure it’s a problem if costs are involved. Here’s the graph:
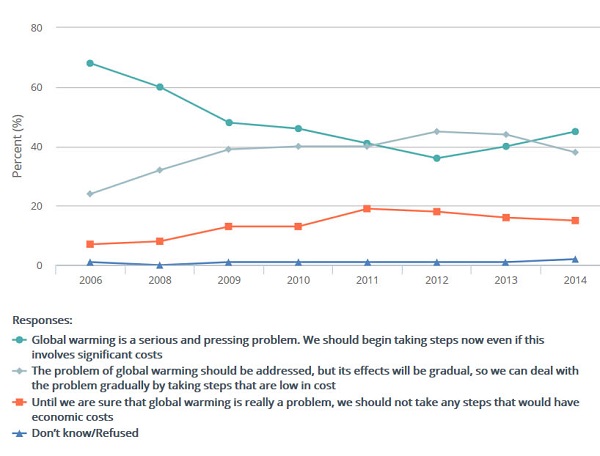
63% of people thought the government should be taking a leadership role in reducing emissions.
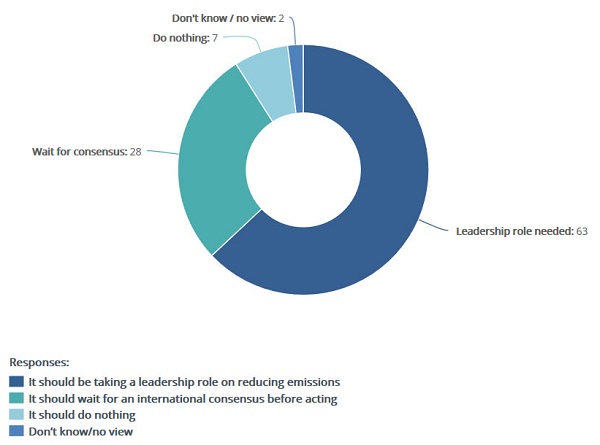
I guess Abbott would claim that’s what they are doing.
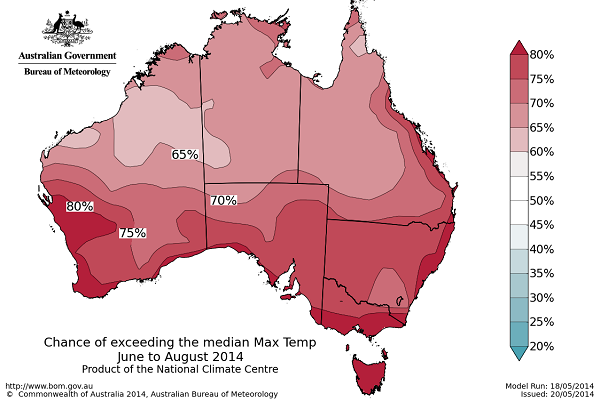
7. Heat wave in May
Will Steffen talks here and here about the unusually warm period in May, which I believe officially rates as a heat wave.
A remarkable, prolonged warm spell occurred over the period 8-26 May, with daytime temperatures 4 to 6°C above normal over much of south-central Australia, extending from South Australia and northwest Victoria into Queensland and the Northern Territory.
The Scientific American noticed.
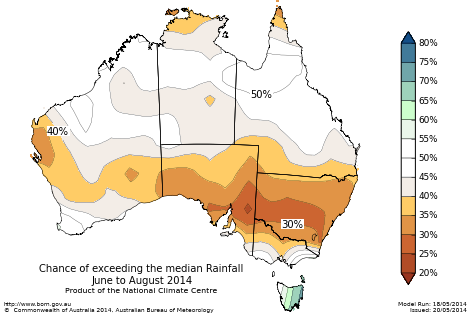
BOM think we are in for a warm winter:
And drier for large parts of the southern mainland:
Reminder: Use this thread as an open thread on climate change.
The game is up
In the post A choice of catastrophes: the IPCC budget approach I explained the socalled ‘carbon budget approach’ in some detail. In general terms:
- In a warming world what matters is the total quantum of CO2 in the atmosphere. The ‘climate budget approach’ identifies the total anthropogenic CO2 emitted to cause warming of 2°C. For a 66% chance of staying under 2°C the total CO2 emitted must not exceed 1000Gt, according to calculations done by Malte Meinshausen and others back in 2009. The later we leave cutting the harder we have to cut.
Rahmstorf’s budget was about 1000Gt of CO2 or about 1500GT of CO2 equivalent with other greenhouse gases for a 25% chance of staying within 2°C. Then
- as Giles Parkinson reports, the carbon budget figures have taken a haircut to become 800Gt for a 66% chance of 2°C when “accounting for non-CO2 forcings”. Problem is we’d already used up 543Gt of the budget by 2011.
David Spratt now tells it straight: Continue reading The game is up
Climate clippings 98
This edition includes important updates on Greenland and Antarctica, global food supply, CSIRO cuts, CO2 levels moving decisively past 400 ppm and CO2 compared to global temperature rise.
1. Greenland may melt faster than expected
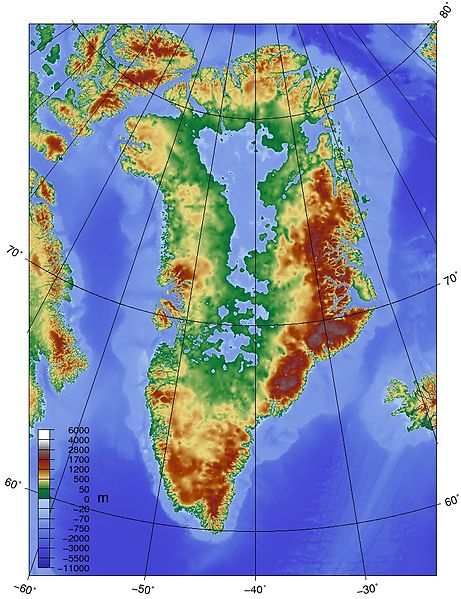
You may recall from the post Arctic images I included an image of the underlying topography of Greenland (Figure 5). It is saucer-like with large areas inland below sea level. The glaciers tend to drain through narrow gateways in the external rim. So they tend to be narrow and fast-flowing:
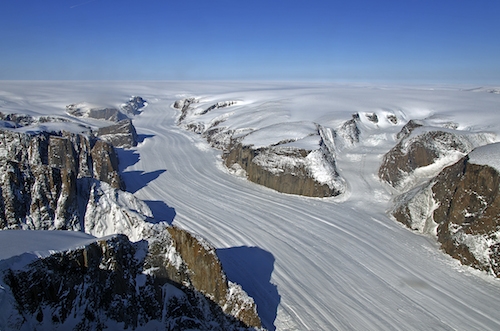
The mouths of most glaciers are melting from contact with warmer seas. It was felt that as this process continued the ice would lose contact with the water, slowing the melting.
New studies of the topography have shown that many of these channels are below sea level.
Valleys underlying many of the glaciers stay below sea level and extend much farther inland than previously suggested, so warm ocean currents that have migrated northward with the changing climate could eat away at the ice for much longer than current climate models suggest. “It will take much longer for these glaciers to lose contact with the ocean,” study author Mathieu Morlighem, of the University of California, Irvine, told Climate Central.
2. Melting Antarctica could devastate global food supply
A new report is the “first to factor in the effects of the slow-motion collapse of the Western Antarctica ice sheet on future food security.”
About time, I’d say.
The report acknowledges recent findings that that the retreat of the Western Antarctica ice sheet was unstoppable – and could lead to sea-level rise of up to 4 metres over the coming centuries.
“That sea-level rise would take out half of Bangladesh and mostly wipe out productive rice regions in Vietnam,” Nelson told The Guardian. “It would have a major effect on Egyptian agricultural areas.”
“A sea level rise of 3 meters (10 feet) over the next 100 years is much more likely than the IPCC thought possible,” the report said.
In terms of absolute land loss, China would be at risk of losing more than 3 million hectares (7.4 million acres). Vietnam, India, Bangladesh, and Myanmar could lose more than 1 million hectares (2.5 million acres), the report said.
The report recommends a radical increase in expenditure on agricultural research, which has been in decline everywhere over recent decades.
3. CSIRO cuts
The federal government cut CSIRO’s funding by $111 million over four years, which will result in 500 job cuts.
Dr Borgas [president of the CSIRO Staff Association] said a plan to move the Aspendale Laboratories to the organisation’s larger site in Clayton had been previously discussed but had come to nothing.
He said it was unclear whether the relocation would reduce the research performed by the 130 staff, which includes ice core analysis, air quality and pollution research and climate and atmospheric modelling.
Most countries planning for a future increase their scientific research funding.
4. CO2 levels decisively pass 400 ppm
During April all 12 World Meteorological Organisation northern hemisphere monitoring stations passed the 400 ppm mark, the first time ever. This is how such a level compares to the 800,000 year ice core record:
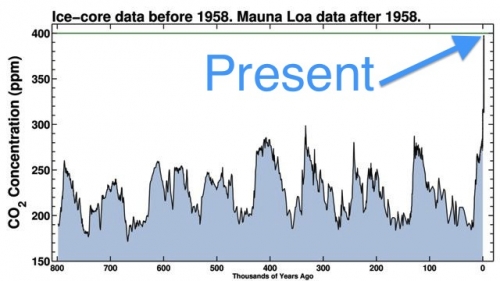
When was it last this high? Possibly 15 million years ago, when it was warmer and there wasn’t much ice around.
“This was a time when global temperatures were substantially warmer than today, and there was very little ice around anywhere on the planet. And so sea level was considerably higher — around 100 feet [30 metres] higher — than it is today,” said Pennsylvania State University climate scientist Michael Mann, in an email conversation. “It is for this reason that some climate scientists, like James Hansen, have argued that even current-day CO2 levels are too high. There is the possibility that we’ve already breached the threshold of truly dangerous human influence on our climate and planet.”
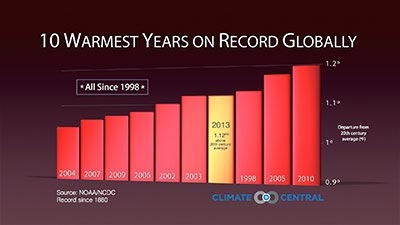
5. Global temperature and CO2
I came across this graph from the NOAA National Climatic Data Center plotting CO2 levels against temperature rise. While correlation does not mean causation there is simply no alternative explanation.

If you take out 1998, which can be regarded as an outlier, the socalled ‘pause’ is only apparent from 2005, which is too short a time to mean anything.
There is another view which sees temperature responding in step-wise fashion. On that basis we may be due for another step, and with an El Niño likely…
Here’s one showing the ten warmest years on record, all since 1998:
Reminder: Use this thread as an open thread on climate change.
Antarctic images
In this post I’ve included a series of explanatory images of the Antarctic in order to assist understanding the peril we are in from changes there, and why the Antarctic is going to be central to the climate change story over the coming centuries. What happens to the grandchildren of those who are children now is the big concern. In large part these images relate to items 2-4 of Climate clippings 96.
The first shows the giant vortex of winds, the strongest for at least 1000 years, ripping around Antarctica in a tight circle:
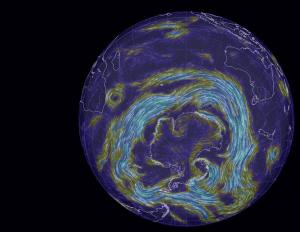
These winds draw rain away from southern Australia, and isolate Antarctica to some extent in terms of atmospheric warming. But they also churn up the ocean, leading to deeper mixing of heat and greenhouse gases.
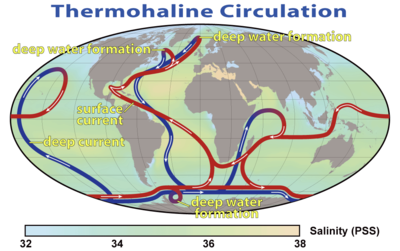
Both the deep and the shallow formations of the thermohaline circulation system wrap themselves around the Antarctic:
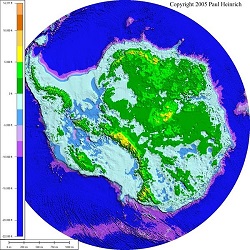
One way or another warm water is penetrating through to Antarctica. The underlying topography of Antarctica reveals much of the land lying below sea level:
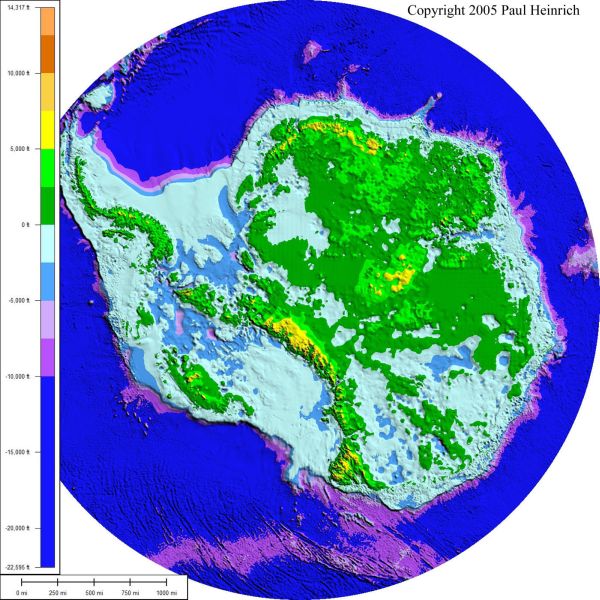
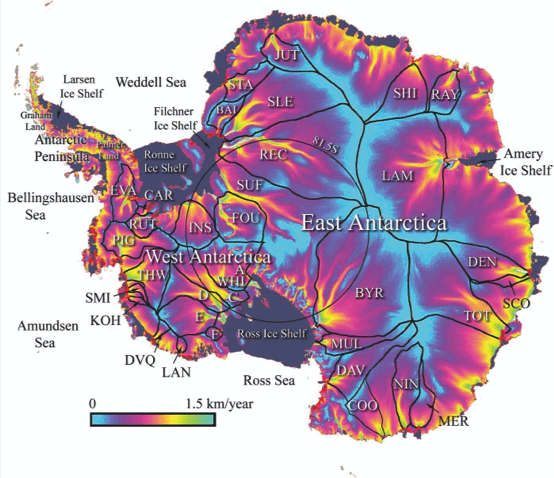
The borderline between blue and green marks sea level. Warmer water is coming directly into contact with the ice sheet and chewing away at the bottom of the ice shelves which form plugs holding up vast quantities of ice in the glaciers stretching hundreds of kilometres inland. The following image shows how the continent drains:
There is concern now that West Antarctica has tipped and with East Antarctica also more vulnerable than previously thought, sea level rise of some metres is now inevitable even if we were to somehow instantly curb greenhouse emissions.
Greenland is quite a different problem. For starters the underlying topography is saucer shaped, with glaciers exiting to the sea through ‘gates’. This image shows the topography:
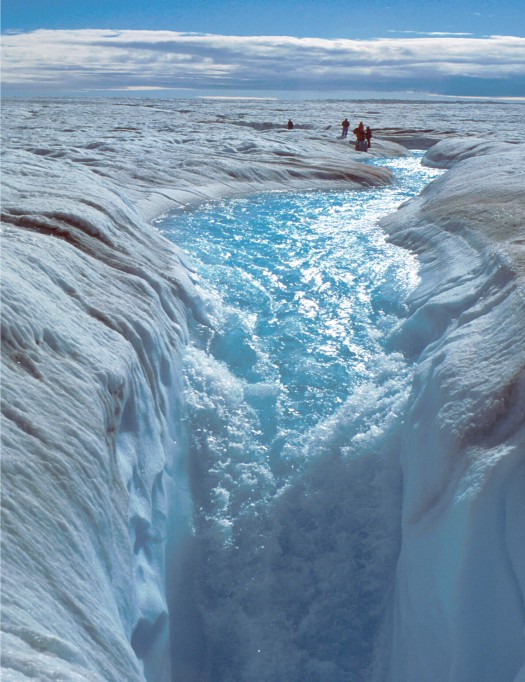
Greenland melts very much from the surface, so its largely a matter of meltwater penetrating, indeed plunging at times, through the surface to the rock below and glaciers speeding up. This image shows some people standing where I’d never stand:
This image shows melting covering the entire Greenland ice sheet for a few days in 2012:
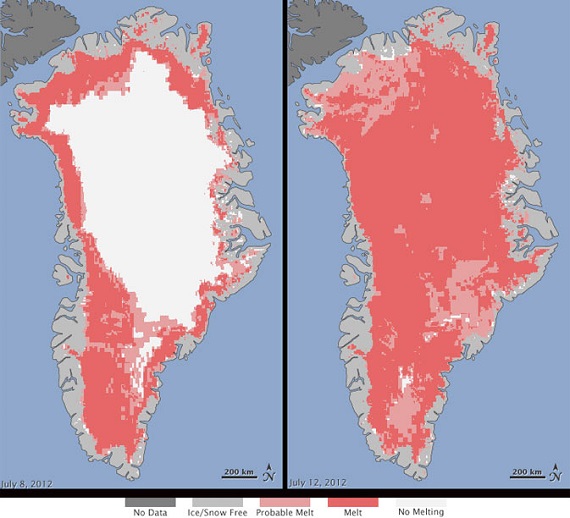
The panel on the left shows a more typical summer melt pattern, which is advancing noticeably over short time frames of a few years.
In the Antarctic, this image shows surface warming over the period 1981-2007:
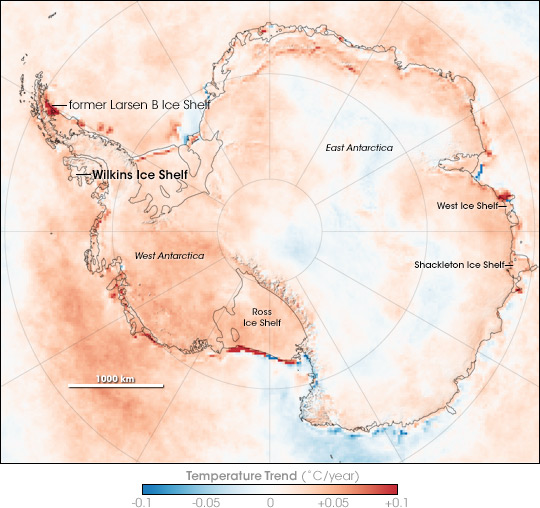
But with the average temperature around -39°C on the East Antarctic ice sheet, which is four kilometres high, that huge lump of ice is relatively stable. This image from NASA in 2005 shows significant perimeter surface melting around East Antarctica:
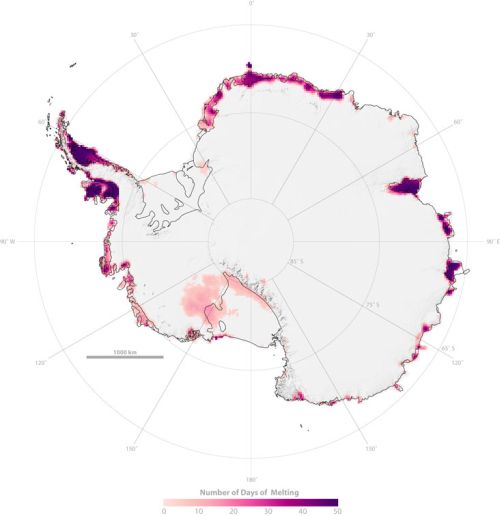
The new research sees concern that warmer sea waters may destabilise the ice further inland than previously thought. Match the red blobs on East Antarctica with the drainage map at Figure 4.
Of some some concern and some comfort is the Andrill Project which found that “the West Antarctic ice sheet has collapsed and regrown over 60 times in the past few million years”. This image shows what happened about a million years ago over a 12,000 year period:
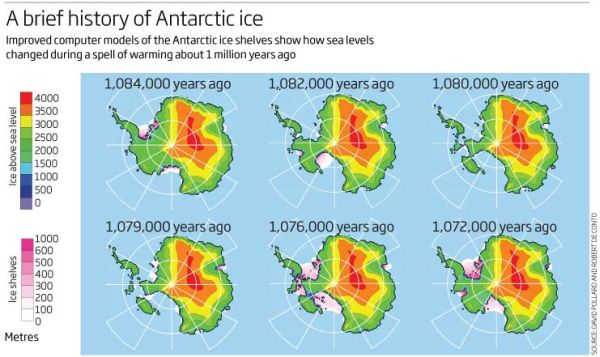
Concern because the Andrill research shows what can happen with mild orbital forcing (the Milankovitch cycles) as the main driver. I understand that CO2 concentration back then was only 400 to 450 ppm, which is where we now, implying that we are already committed to wasting the West Antarctica ice sheet. There is some comfort, however, that a change in the orbital forcing, which is far weaker than what we are doing now, arrested the melt in West Antarctica and brought the ice sheet back again. There was no tipping point which saw the whole East Antarctic sheet disappear.
For perspective I’ll post one of my favourites, a graph from David Archer in 2006 showing the broad relationship between temperature and sea level:
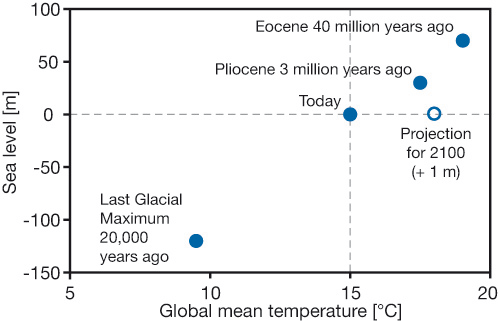
Do not connect the dots with straight lines. Most importantly, I think we now stand at the upper level of a 2°C interval where the sea level did not change much. The NH continental ice sheets had disappeared and the remaining ones – Antarctica, Greenland and the Arctic – were not seriously in play. Even now the main sources of sea level rise lie elsewhere. This table (13.1 from the IPCC5 WG1 Technical Summary) shows what’s happening:
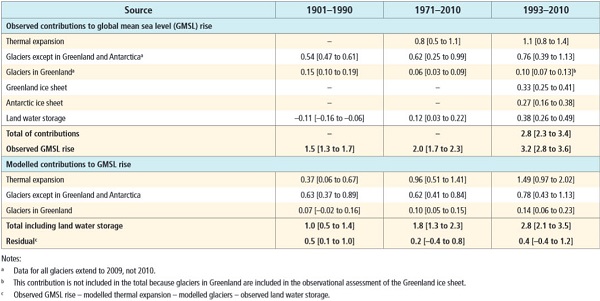
That’s hard to read, so here are the figures for the average annual expansion for 1993-2010:
-
Thermal expansion – 1.1mm
Glaciers except Greenland and Antarctica – 0.76mm
Glaciers in Greenland – 0.10mm
Greenland ice sheet – 0.33mm
Antarctic ice sheet – 0.27mm
With 4-5°C we can expect complete deglaciation and 75 to 80m sea level rise, made up of East Antarctica 59m, Greenland 6-7m, West Antarctica 5-6m, other glaciers and ice caps about 0.5m and thermal expansion, I don’t know, but I think in single figures. Greenland and Antarctica are accelerating rapidly and some time this century will become the top two contributors. These graphs from Skeptical Science are instructive:
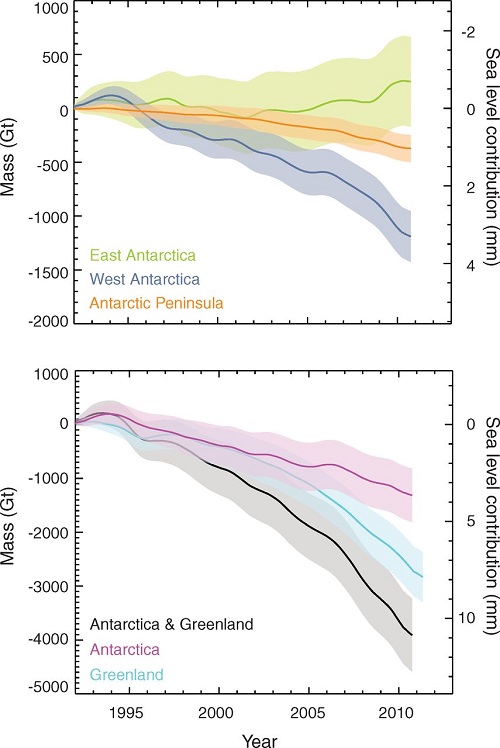
Greenland and West Antarctica are in a death spiral of accelerating ice sheet decay. It’s happened 60 or more time before in recent paleo history. West Antarctica, being more vulnerable may overtake Greenland.
One could say from this that East Antarctica is not yet in play, but science seems to suggest it is not far away.
When ice sheet decay gets going Hansen sees it as possibly progressing in geometric fashion, producing a curve like this:
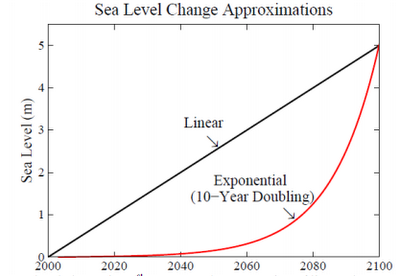
My thinking is that East Antarctica will tip sometime in the next decade, and that ice sheets will decay from there in a pattern that is more exponential than linear. Hansen’s scenario, which he puts forward as a serious possibility, does not look crazy.
I suspect that we are already committed to double digit sea level rise, and there’s not a thing we can do to prevent it; the question is when will it happen? We can only adapt and minimise.
I suspect also that things will go seriously pear-shaped during the latter part of this century. Pity our grandchildren’s grandchildren.
Update: There is a short ABC video news item about the Antarctic ice melt doubling since the last survey. At the end it says the process could take 1000 years. For a complete melt that would be lightning fast – 7.5 to 8 metres per century, or a metre every 12-13 years. We are pushing the system more than 10 times faster than it has ever been pushed before.
See also Gareth Renownden Goodbye coastline: we are beyond the point of no return.
Climate clippings 96
 This edition looks at changes in the cryosphere, a major US report, the prospects for an El Niño and the problem of China burning coal.
1. Pacific Ocean hot spot
Scientists have discovered a hot spot in the Pacific Ocean which is partly responsible for global warming in the Arctic. Incredibly this hot spot is east of Papua New Guinea.
This phenomenon is attributed to natural variations rather than global warming. Therein, perhaps, lies the reason that scientists have been constantly surprised by the rapidity of the Arctic sea ice loss.
2. Southern Ocean winds strengthening and moving south
Scientists have confirmed in a study covering the last 1000 years that winds are strengthening in the Southern Ocean and moving south. They found a definite trend greater than can be explained by natural variability and attributable to the effect of increased greenhouse gases.
Hence the drying of southern Australia is expected to continue. Also the tightening of winds around Antarctica inhibits warming of the continent. Nevertheless the warming of West Antarctica is considerable.
3. Antarctic glaciers melting past point of no return
A group of melting glaciers in West Antarctica appears to have reached the point of no return according to scientists from NASA and the University of California Irvine. Even if we cut back greenhouse gas emissions savagely now the melting will continue. We are probably looking at 3 to 5 metres of sea level rise, from Antarctica alone – that is our gift to future generations. Dangerous climate change is no longer just a future possibility, it’s happening now!
The question is, how long will it take? Here there is uncertainty. It could be as short as two centuries or as long as nine. Professor Eric Rignot thinks two centuries is “not outrageous”.
4. East Antarctica more vulnerable than thought
Part of East Antarctica is more vulnerable than expected to a thaw that could trigger an unstoppable slide of ice into the ocean and raise world sea levels for thousands of years, a study showed on Sunday.
The Wilkes Basin in East Antarctica, stretching more than 1,000 km (600 miles) inland, has enough ice to raise sea levels by 3 to 4 meters (10-13 feet) if it were to melt as an effect of global warming, the report said.
The Wilkes is vulnerable because it is held in place by a small rim of ice, resting on bedrock below sea level by the coast of the frozen continent. That “ice plug” might melt away in coming centuries if ocean waters warm up.
“East Antarctica’s Wilkes Basin is like a bottle on a slant. Once uncorked, it empties out,” Matthias Mengel of the Potsdam Institute for Climate Impact Research, lead author of the study in the journal Nature Climate Change, said in a statement.
Wilkes basin could be more vulnerable than West Antarctica, but perhaps on longer time scales. Again there is concern with tipping points. James Hansen famously said, You can’t sling a rope around an ice sheet!
5. Climate change is clear and present danger, says landmark US report
Climate change is already severely impacting US economy, ecology and health, according to the the third National Climate Assessment report. Arid areas will become dryer, moist areas wetter and wildfires and storms will become more frequent and severe. For example floods have increased in frequency, mainly in the Midwest and Northeast:
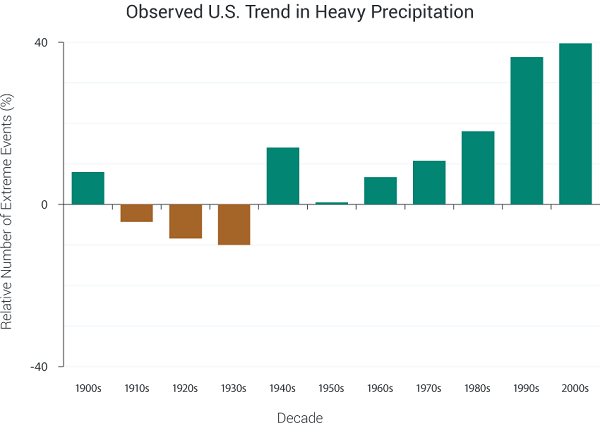
Climate change has moved from distant threat to present-day danger and no American will be left unscathed, according to a landmark report due to be unveiled on Tuesday.
The National Climate Assessment, a 1,300-page report compiled by 300 leading scientists and experts, is meant to be the definitive account of the effects of climate change on the US. It will be formally released at a White House event and is expected to drive the remaining two years of Barack Obama’s environmental agenda.
The findings are expected to guide Obama as he rolls out the next and most ambitious phase of his climate change plan in June – a proposal to cut emissions from the current generation of power plants, America’s largest single source of carbon pollution.
Joe Romm at Climate Progress has more, while Emily Atkin looks at the impact on indigenous groups in Alaska and Pacific Islands.
6. Chances of El Niño almost 4 out of 5
The chances of an El Niño developing this year are now at almost 80% according to some estimates. This graph shows the increased temperature in El Niño years.
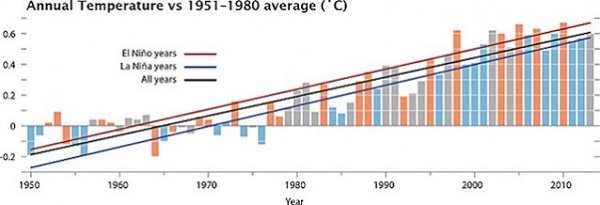
It could be a warm one.
Parts of the western United States suffering chronic drought could have flooding rains. In Oz where large areas are in drought, there would be even less chance of relief.
7. China, please stop using coal!
China should put a cap on greenhouse gas emissions from coal by 2020, and then swiftly reduce its dependency on the fossil fuel, according to a new study. Otherwise climate change will be impossible to stop.
Of relevance, back in 2011 the IEA said that after 2017 any new fossil fuel power generation should be matched by the decommissioning of equivalent existing capacity.
Reminder: Use this thread as an open thread on climate change.
Climate clippings 95
1. Pacific winds slow global warming
A team of Australian scientists has found that stronger winds in the Pacific are slowing global warming (paper here, paywalled).
The study found that the winds were churning the Pacific like a washing machine, bringing the deeper colder water to the surface and pushing the warmer water below.
Scientists do not expect the effect to last. Matthew England of the University of New South Wales:
“The phase we’re in of accelerated trade winds particularly lasts a couple of decades,” Professor England said.
“We’re about 12 to 13 years in to the most accelerated part of the wind field.”
There’s more at The Conversation, at Open Mind plus Matthew England at RealClimate and Mike Mann at Huff Post.
The heat is only at a depth of 100 to 300m, so may easily become available to the atmosphere again. Mike Mann thinks the winds and the La Niña effect may be the result of global warming.
2. Animals and plants on the move
The CSIRO have developed a fascinating map showing species on the move due to climate change. I’ve done a screenshot here, but the animated version in the link is best:
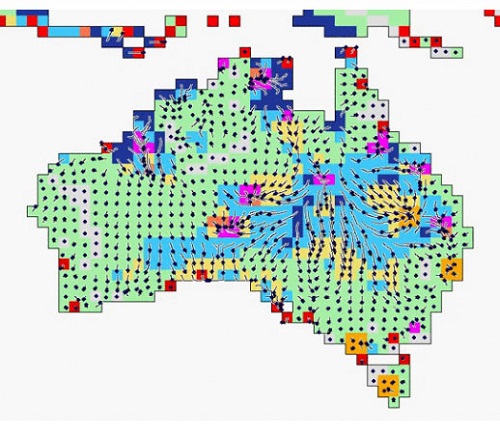
Blue areas indicate significant change and pink areas show “corridors” where animals and plants may be able to move through to more favourable conditions.
“Sink” areas, in orange, show where the movement of land-based species is likely to hit a dead end, by reaching a coastline or mountain range.
Something strange is happening in the middle of Queensland.
3. The year’s weather in 8 minutes
Gareth at Hot Topic has posted a live map of the weather for 2013 as seen from weather satellites. I recommend using the full screen button.
It’s interesting not so much for 2013, but as an overview of how the global system works.
4. Half new energy is green
Fully 44% of all generating capacity installed last year around the world was renewable, says the latest UNEP Global Trends in Renewable Energy Investment, despite a 14% decline in renewables investment, and in new electricity generally.
Europe has cut investment in renewables by 44%. China now leads with $56 billion invested last year.
Shares in clean energy companies rose 54% last year.
5. Germany turns to brown coal
Germany has more wind turbines and solar panels than any other industrialised country, but it also burns more brown coal (lignite) than any other.
As Germany turns off its nuclear power, gas is expensive and a third of it comes from Russia. In these circumstances Germany is turning to lignite to solve the intermittency problem. Because lignite takes 8 hours to fire up plants are run at 40% whether needed or not.
There are three options:
- storage systems, such as pumped water or hydrogen
- improving and extending electricity grids so that surpluses can be moved to areas of need
- organising tariffs to manage demand from big energy users that have intermittent demand.
None of these is being implemented so far to the extent that makes a real difference.
6. Energy use in UK and Germany
Germany generates considerably more energy than the UK, even when population is taken into account.
This graph shows the source of Germany’s power generation for the first quarter of 2014:

Nuclear, being phased out over a decade, is a considerable source. Biomass is larger than gas.
Renewable energy is expected to be the main source of electricity generation in Germany by 2030, but policy in both countries is a concern:
In the UK, the Conservative party has recently announced that it will put a cap on onshore wind expansion if it gets into power in 2015. Subsidies for solar power are also likely to be cut, according to media reports – suggesting that Conservatives are increasingly hostile to plans to expand renewables.
In Germany, the government’s putting in place a new renewables plan – possibly in response to concern about rising energy prices. The new rules mean from 2017 energy providers will no longer get guaranteed prices for their power, according to media reports. The effects are unclear, but could slow the growth of German green energy.
7. But then, in Germany at least…
…energy policy is very complex.
In Germany governments attempt to control markets, it seems.
Germany’s energy transition – the Energiewende – has largely been a bottom-up grassroots movement over the past 25 years. Citizens and energy cooperatives account for roughly half the investments. Large utilities are only just now getting on board.
Current changes in policy are aimed at tipping the balance back towards the large corporates, while keeping renewable energy development on track. Policy is also favouring offshore rather than onshore wind.
The article mentions that discussion will now turn to “capacity payments”. I suspect such payments will be necessary to provide backup capacity for intermittency problems, especially if weather forecasts are wrong. For continuity of supply the corporates may have to be paid for unused reserve capacity.
Reminder: Use this thread as an open thread on climate change.
Climate change impacts: IPCC Working Party 2 report
On 31 March the IPCC released its second report in the current series, this one on Impacts, Adaptation and Vulnerability. Follow the links from the report website. We looked at the first report, The Physical Science Basis here, here and here. The third report, Mitigation of Climate Change is now also out, and the final Synthesis Report is scheduled for in September. The series comprises the Fifth Assessment Report.
The IPCC was formed in 1988 and produced assessment reports in 1990, 1995 and 2007. As Graham Readfearn says, the message is the same – we are going to hell in a handbasket – and yes, at that level it’s becoming monotonous.
There is a change, however. It lies in the fact that the impacts of climate change are now all around us. We are not just getting warnings, we are living climate change. The impacts we see locally are integrating into a global pattern, which also includes large-scale transforming events, such as the drying of the Sahel and the loss of sea ice in the Arctic. Increased extreme weather is becoming part of the common experience. In this we are on a path where one in 100 events in any year may become one in three or five. We risk losing whole ecosystems such as the coral reefs where many are in trouble now and all will be by about mid-century, almost certainly. Finally, there is much greater certainty that climate change is happening and about our agency in it. With that certainty comes greater risk, but also opportunity to take action to adapt and to mitigate.
I’ve patterned that paragraph on Greg Picker’s explanation to Steve Austin, while changing the order of the points he made and adding some detail.
The report is organised into two “volumes”, with the first containing 20 chapters, including, for example, one on Human health: impacts, adaptation, and co-benefits and one on Human security. These sectoral reports will provide valuable reference material for years to come.
The second volume comprises 10 “regional aspects” including the ocean.
One of the 10 is on Australasia.
Impacts on Australia
Chapter 25 identifies eight significant impacts for Australia:
- There is the possibility of widespread and permanent damage to coral reef systems, particularly the Great Barrier Reef and Ningaloo in Western Australia.
- Some native species could be wiped out.
- There is the chance of more frequent flooding causing damage to key infrastructure.
- In some areas, unprecedented rising sea levels could inundate low-lying areas.
- In other areas, bushfires could result in significant economic losses.
- More frequent heatwaves and temperatures may lead to increased morbidity – especially among the elderly.
- Those same rising temperatures could put constraints on water resources.
- Farmers could face significant drops in agriculture – especially in the Murray-Darling Basin.
University of Queensland marine scientist Ove Hoegh-Guldberg worries that reefs could be severely damaged or disappear by mid-century.
A worst case scenario could see agricultural production reduce by 40% in the Murray-Darling Basin, and in south-east and south-west Australia. The National Irrigators Council says that’s why you have irrigation. However, there is a lot of dry-land farming in these areas and the future average rain is more likely to come in the form of floods when most of the water flows through to the sea.
The above scenarios are risks rather than certainties. However, they add up to a strong chance of dangerous climate change.
Increased certainty
The change in certainty in the attribution of climate change to human activity is conveyed in this image from Dr Jeff Masters’ WunderBlog last year:
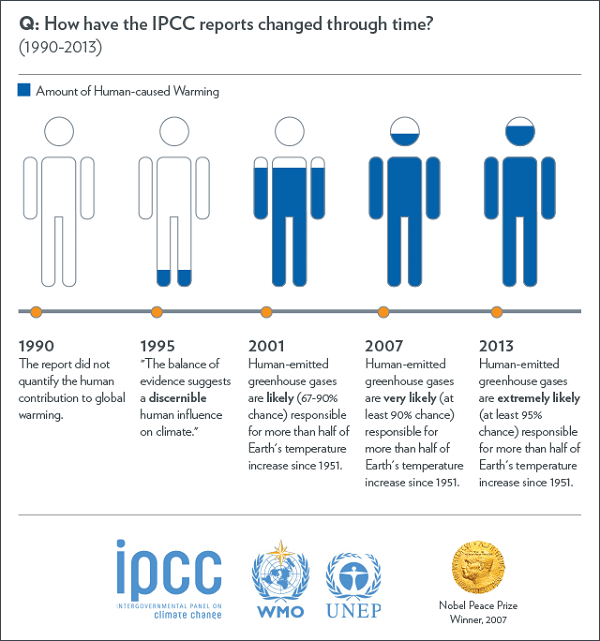
Back in 1990 we saw the possibility of continuing change but what we had experienced at that time could easily have been natural variations subject to reversal. In any case there was low confidence that we could do anything to mitigate. Furthermore, why take measures to adapt, when there was no real certainty?
Now the story has changed dramatically. The pattern and the dominant causes are clear.
Adaptation
From page 27 of the Summary for Policymakers we find a graphic packed with information about various aspects of the impacts of climate change (sorry the graphic is too large to display here!) In the right hand column we find bar graphs showing the present, near-term (2030-2040) and the long-term (2080-2100) risk with hatching to show potential for mitigation through adaptation. The long-term risk is displayed in separate 2°C and 4°C bars.
Little adaptation is possible with Australia’s coral reefs, none at 4°C when the risk becomes very high.
Terrestrial ecosystems losing ice cover in the polar regions are similarly not amenable to adaptation and become very high risk at 4°C.
Loss of crop productivity becomes very high risk at 4°C with little possibility of adaptation. Ditto for heat-related mortality in Asia, North America and, presumably, elsewhere.
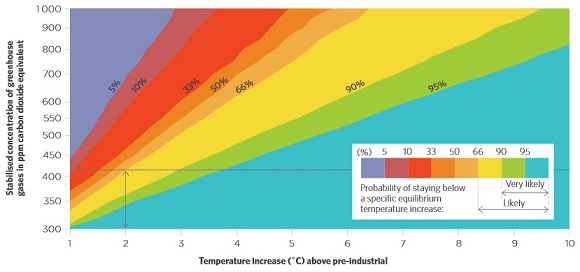
Burning embers
The extensive detail in these tables is summarised in a new improved version of the ‘burning embers’ diagram, shown below:
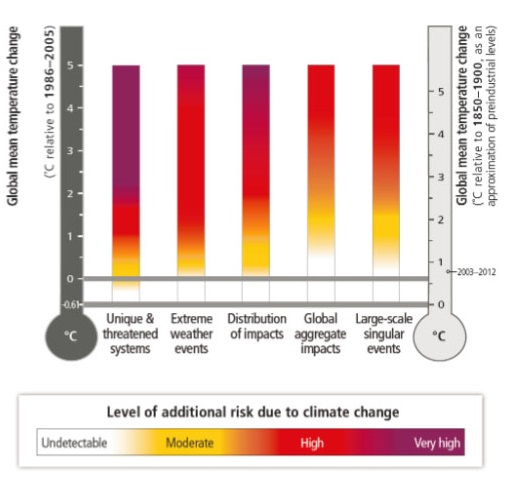
From this we can readily see that the 2°C ‘guardrail’ marks a fairly arbitrary point on the gradation from dire to downright dangerous.
Climate clippings 93
1.Three reports
First, the Climate Change Authority released a Draft Report of its Targets and Progress Review.
I have a draft post in the bin, which I’ll publish after Easter. Labor are likely to adopt the enhanced targets it recommends, whereas the LNP have confirmed they won’t go beyond 5% by 2020.
Second, I’m working on a post on the IPCC’s second report in the current series, released on 31 March Impacts, Adaptation and Vulnerability. To get a head start you can follow the links from the report website.
I should be able to finalise the post for the week after Easter.
Third, the Summary for Policymakers of the IPCC’s third report Climate Change 2014: Mitigation of Climate Change was released on Monday. I hope to tackle it over Easter, aiming for publication the second week after Easter. The ABC has comment: politicians and Frank Jotzo and John Connor. The Carbon Brief has a lot of useful material.
2. The cost of mitigation
The IPCC mitigation report puts the cost of action at 0.06% of GDP, but calculating the cost is complex, especially when looking at the damage caused by doing nothing.
Researchers Rosen and Guenther find that the economic modelling is not possible, there are too many variables and too many unknowns.
Yet crisis trumps uncertainty, we have no real choice but to act.
3. Trouble in the vineyards
Early ripening is becoming a huge problem for growers and wineries.
growers say they’re having trouble processing their crop because it’s ripening too quickly.
Researchers are blaming climate change, with warmer conditions and drier soils accelerating the ripening process.
4. Microbes cause Permian–Triassic extinction?
The Permian–Triassic extinction event, commonly known as the Great Dying, was responsible for the extinction of roughly 90% of all life on Earth.
According to new research at MIT the event may have been caused by microbes.
The team’s research indicates that the catastrophic event was in fact triggered by the tiniest of organisms, a methane-releasing microbe called Methanosarcina. New evidence suggests that at the time of the extinction, the microbes appeared in massive numbers across the world’s oceans, spreading vast clouds of the carbon-heavy gas methane into the atmosphere. This had the effect of altering the planet’s climate in a way that made it inhospitable to most other forms of life inhabiting Earth at that time.
5. Land clearing returns to Qld
According to The Wilderness Society the Queensland Government has approved the clearing of 30,000 hectares at Strathmore Station in the Gilbert River catchment in the Gulf country, which will add the equivalent of 4.2-6.6 million tonnes of carbon dioxide into the atmosphere, the same as running up to another 2.6 million cars on our roads.
Strathmore wants to clear another 70,000 hectares. Together with another proposed Gilbert River project, IFED’s so-called Etheridge mega farm, the two schemes would clear and flood 200,000 hectares of land.
That would be like bulldozing a 10km wide strip for 200km.
6. Instruments of persuasion
Dr Rod Lamberts of the Australian Centre for Public Awareness of Science at the ANU says it’s time to dump science and facts as instruments of persuasion in favour of advertising and marketing. He says we need to appeal to people’s emotions, which will
have a stronger effect than trying to appeal to their brains via some kind of, you know, fact channel.
But please note, the facts are needed to support the campaign:
If the goal is to affect change, then I believe we need to step more into the realms of advertising and marketing and so on, in terms of delivering messages that are supported by what the science is telling us, but don’t have the science in those messages. (Emphasis added)
Jane Caro agrees on the need for a different approach:
Facts have never changed anyone’s mind about anything, sadly. It’s very hard for scientists to understand this, because they’re highly rational people, but in actual fact, no-one has ever been rationalised out of a belief.
There are only two things that change people’s attitudes and behaviour, particularly their behaviour, and they’re two emotions, and they’re hope and fear.
Again, facts and the science are surely needed to rationalise a changed belief. Beliefs need reason to support them.
Who mounts and pays for an advertising and marketing campaign? We look to governments, but in Australia they are the actual problem.
7. Direct Action less popular than the price on carbon
Meanwhile Essential Media Communications have done a survey of opinion that shows Direct Action distinctly less popular than the price on carbon. In terms of age, there is a tipping point beyond which the doubters predominate and it’s age 55. Abbott’s climate policy may come back to bite.
as the flat-earthers take control of the Federal Government, more Australians than ever have come to the conclusion that the Earth is in fact round.
Changing our policymakers seems the best way home but then Labor needs to offer more than tokenism. In my opinion Labor politicians should be the prime target group. The current mob won’t change without a spell in opposition and transformational ideological renewal.
Reminder
Use this as an open thread for climate topics.
Extreme weather
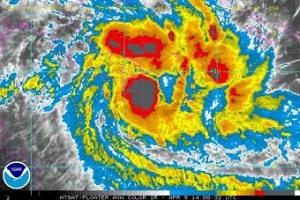 As Cyclone Ita bears down on the coast of Far North Queensland I was reminded of the post I drafted in late February on extreme weather. Ita is rated as category 4, hence severe. On the upside few people live in the expected path. On the downside the people who do are not likely to get much help from the outside world.
The incidence of cyclones is not expected to increase with climate change, although I understand the story could be different in the Caribbean and the NW West Pacific. However, we are likely to get more severe cyclones and they may be more intense.
Here’s the post as I wrote it.
This summer, Australians again endured record-breaking, extreme heatwaves and hot weather. My daughter in Adelaide, for example, experienced a record 13 days of 40°C-plus maximums. The Climate Council’s latest report Heatwaves: Hotter, Longer, More Often came up with four key findings:
First, climate change is already increasing the likelihood and severity of heatwaves across Australia. Second, heatwaves have widespread impacts including increased deaths, reduced workplace productivity, damage to infrastructure such as transport and electricity systems, mortality of heat-sensitive plants and animals, and stress on agricultural systems. Third, record hot days and heatwaves are expected to increase further in the future. And finally, limiting future increase in heatwave activity requires urgent and deep cuts to greenhouse-gas emissions.(Emphasis added)
While the 2009 Black Saturday bushfires killed more than 170 people, the preceding heatwave killed double this figure. In fact heatwaves kill more Australians than any other natural disaster, a fact largely unremarked. The following graph plots 2009 deaths against temperature and the 2004-08 average.
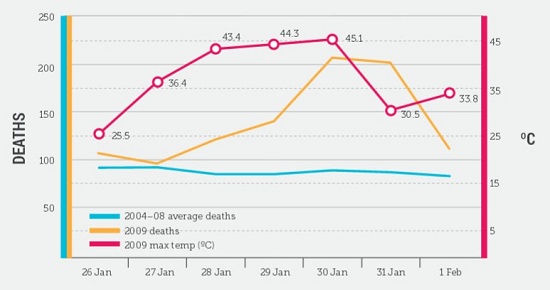
According to the report it has been estimated that heatwaves could cause an additional 6214 deaths in Victoria alone by 2050.
Adelaide’s heatwaves are an average 2.5°C hotter than they were half a century ago, and peak heat days are 4.5°C hotter.
Hot days, previously considered to be “once-in-20-years” occurrences, will start to happen every two to five years in Australia by mid-century.
At the end of the report they return to their constant theme – this is the critical decade in which to take action.
Meanwhile in Toronto where my sister lives they had an ice storm around Christmas and have been living in below zero temperatures ever since (time of writing, 19 February). The snow shovelled from their driveway doesn’t melt, so the pile goes up and up and up. Of the cities listed on the weather page of our local rag only Montreal has been consistently colder.
(Update: I think the cold spell lasted at least another month.)
At the same time weather historian Christopher C Burt blogged about record warmth in Alaska.
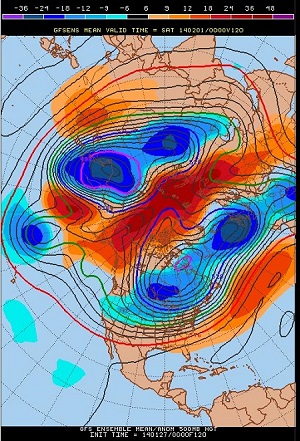
He shows an amazing map of the forecast for February 1st at the end of the post. It’s stunning, showing the Northern Hemisphere weather split by a stream of warm air directly across the North Pole:
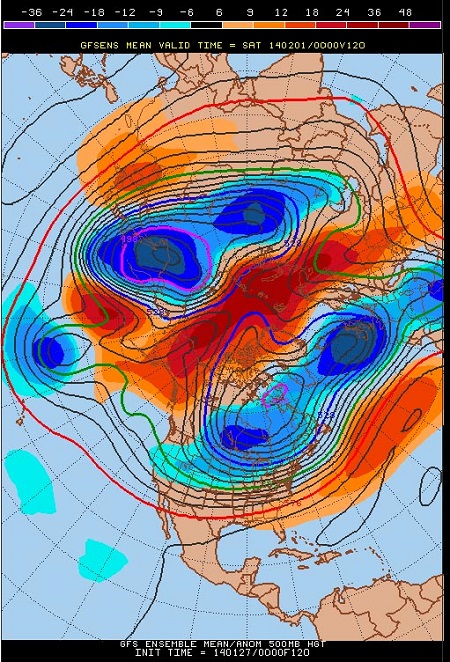
There is a related post at Dr Jeff Masters’ Wunderblog he says:
The cold air flowing out of the Arctic into the eastern half of the U.S. is being replaced by warm air surging northwards over Alaska and the North Atlantic east of Greenland. The warmth in Alaska the past three days has been particularly astonishing, with Alaska observing its all-time warmest January temperature of 62°[F] on Monday 1/27 at the Port Alsworth Climate Reference Network station, according to Rick Thoman of NWS Fairbanks. This ties the January state record set at Petersburg on January 16, 1981. Port Alsworth is about 160 miles southwest of Anchorage.
Nome, Alaska recorded a high of 51°F [10.5°C] on Monday. This was 38°[F] above average, and the warmest temperature ever observed in any November through March in Nome since record keeping began in 1907. (Emphasis added)
I think 38°F is about 21°C.
Elsewhere I’ve read that the US and Canada were 5°C colder than the 1951-1980 base in December, while north-eastern Europe and Siberia were 9°C warmer. Berlin and Moscow seem rather balmier than usual.
We are normally told that the jet stream has slowed down but for a time in February it speeded up, while being stuck in one place. The effect of this was to fling low pressure systems at the UK, where they experienced record floods.
Back in Oz again, much of the country is in severe drought, although, ironically, the grand tour by Abbott and Barnaby Joyce into the drought areas was interrupted by rain. Of course, one dump of rain doesn’t necessarily break a drought and the prospect for the coming 2014-15 summer is 75% stacked in favour of an El Niño. More records could be broken, including global average surface temperatures.
During this critical period of necessary climate action the Abbott government has appointed a climate denier Dick Warburton to head up the review of the Renewable Energy Target.
We live in interesting times.
PS One of my favourites from the archives is Remembering the floods.
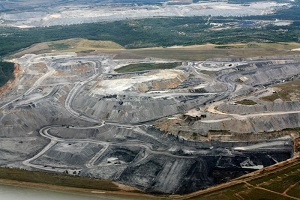
The folly of Abbot point and Galilee Basin
This post was written back when the issues of Abbot Point expansion and the dumping of waste in the Great Barrier Reef Marine Park area were current. Now the Queensland Land Court has recommended the State Government reject the multi-billion dollar GVK-Hancock Alpha Coal project in the Galilee Basin. The decision is a non-binding recommendation to the State Government. If they go ahead, conditions have been suggested.
Impact on groundwater was the main concern of local landowners.
It looks to me as though this decision will not in the end impede the construction of the mine. Nevertheless there are concerns also about the economic viability of both the coal mines and the port expansion, as I discuss in the post.
Abbot Point and the Marine Park
Recently the Abbot Point port expansion proposal has caused a great deal of controversy because of the proposed dumping of 3 million tonnes of sludge within the Great Barrier Reef Marine Park area. The contention is that the Great Barrier Reef Marine Park Authority (GBRMPA) initially found against the dumping. In January this year GBRMPA approved the dumping.
Professor Russell Reichelt, chair and chief executive of the Great Barrier Reef Marine Park Authority, makes clear at The Conversation that the material to be dumped is not toxic and while the Authority would prefer placing dredge material on land, “providing it does not mean transferring environmental impact to sensitive wetlands connected to the reef ecosystem”, they are comfortable with the proposed plans.
The material to be dumped is about 60% sand and 40% silt and clay, similar to what you would see if you dug up the site where the material is to be relocated. The target area is a defined 4 square kilometre site free of hard corals, seagrass beds and other sensitive habitats, about 40 kilometres from the nearest offshore reef.
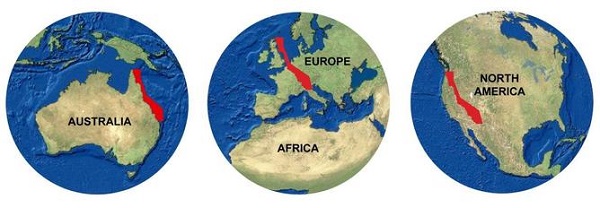
The Marine Park itself is about the size of Italy:
In a comprehensive discussion of the Abbot Point expansion and the Galilee Basin Radio National’s Background Briefing implies that the Abbot Point expansion will not be supervised. The story is told of how in the previous expansion contractor John Holland effectively ignored environmental regulations and was fined a token $195,000 as a result. Professor Reichelt specifies what is to happen this time:
we will have a full-time staff member from GBRMPA located at the port to oversee and enforce compliance during dredge disposal operations. This supervisor has the power to stop, suspend or modify works to ensure conditions are met.
In addition, an independent technical advice panel and an independent management response group will be formed. Membership of both these bodies will need the approval of GBRMPA.
Importantly, the management response group will include expert scientists as well as representatives from the tourism and fishing industries, and conservation groups. Together, GBRMPA and those other independent scrutineers will be overseeing the disposal, and will have the final say — not North Queensland Bulk Ports, which operates Abbot Point, or the coal companies that use the port.
This overview is worth quoting:
Our recent assessments show the dominant risks to the health of the reef are the effects of climate change, excess sediment and nutrient run-off (such as from widespread floods), outbreaks of coral-eating starfish, extreme weather, and some types of fishing.
Coastal development such as ports are assessed as significant but local in their effects.
The effects of climate change.
Watching Greens Senator Larissa Waters debate the Abbot Point expansion with the relevant Qld government minister was like being in an alternate reality. There was no mention of the climate effects of the coal to be exported, no mention of the warming and ocean acidification impact on the reef.
No mention of the impact of the monster mines on the local environment, the use of local aquifers, of the possibility of toxic runoff into the river systems and flood plains the the southwest, the Channel Country and Lake Eyre. As I said last year in Galilee Basin coal: a vision splendid or a kind of madness?:
Water is in fact a considerable issue, as the area has only 400 to 500mm rainfall pa, seasonal and highly variable. Artesian aquifers and water from coal seam gas are being considered. Pastoralists are naturally worried as are environmentalists. The area can be subject to heavy rains which ends up with a toxic brew from open-cut mines being pumped into water courses. The basin drains towards Lake Eyre, (now officially known as Kati Thanda–Lake Eyre).
This image is from an organic beef producer and their enthusiasm has expanded the area to include the whole Simpson’s Desert, but it gives an idea of the part of the country we are talking about:
Moreover the railway line or lines will cut across grazing lands on expansive flood plains, making water movement highly problematic with heavy rain.
Economics of the mining projects
Mercifully both projects look wildly uneconomic. The Background Briefing story quotes a UBS commodities analyst who says that for the Galilee Basin to be profitable the coal price would have to be around AU$110 per tonne. Their long term estimate is $80 per tonne. The program saw India rather than China as being the most prospective customer. India is running out of coal that can be mined, but the current price there is about $23 per tonne (I presume US$). They need electricity for hundreds of millions who rely on wood or cow dung for cooking and heating, but not at any price.
John Quiggin has two posts about companies pulling out and the shaky economics of both projects:
Following a similar announcement last week by Lend Lease, and earlier announcements by BHP Billiton annd Rio Tinto, mining company Anglo American has withdrawn its proposal to take part in the expansion of the Abbot Point coal terminal. That leaves only two proposals, both from Indian companies owned by billionaire entrepreneurs reminiscent of Bond, Skase and other Australian heroes of the 1980s. Both Adani and GVK are heavily indebted conglomerates of the type that invariably emerge when money is cheap, and mostly collapse when the tap is turned off.
It’s not surprising that these companies have not yet abandoned their bids. Doing so would involve booking huge losses on their mining prospects in the Galilee Basin. But, it’s hard to believe anyone is going to lend them the billions required, not just for the port expansion, but for a 500km rail line and the mine itself. The price of coal is well below the level required to cover the costs of extraction and transport, let alone to provide a return on capital. And if Adani and GKV don’t build the rail lines, the development of the entire Basin will grind to a halt.
Here’s hoping!
Update: Mark Colvin discusses the economics of the mine with the ABC’s business editor Ian Verrender, confirming concerns.

State of the Climate, 2014

CSIRO and the BOM have released their State of the Climate 2014 report. Pretty much the same story you’ve heard before, only a bit worse.
There’s a good summary at the special BOM site, where you can download the report. Other than that Climate Citizen has perhaps the best summary.
Graham Readfearn at Planet Oz riffs off the Dorothea Mackellar theme of a “sunburnt country” of “droughts and flooding rains”.
At Radio National’s PM Mark Colvin interviewed CSIRO’s Dr Penny Whetton.
At The Conversation Professor Neville Nicholls emphasises rising heatwaves and fires. Sophie Vorrath has more at RenewEconomy.
I’ll comment on a few sundry aspects.
Level of greenhouse gases
We are told that the global mean for CO2 in 2013 was 395 ppm, or “likely the highest level in at least 2 million years”. Back in the 2012 report the figure of 390 ppm for 2011 was described as “a level unprecedented in the past 800,000 years”. David Spratt at Climate Code Red added a corrective addendum “that should be 15 million years.”
Spratt referenced the work of Aradhna Tripati:
The last time carbon dioxide levels were apparently as high as they are today — and were sustained at those levels — global temperatures were 5 to 10 degrees Fahrenheit [DS: 3 to 6 degrees Celsius] higher than they are today, the sea level was approximately 75 to 120 feet [BB: 23 to 36 metres] higher than today, there was no permanent sea ice cap in the Arctic and very little ice on Antarctica and Greenland.
I’m amazed at how often these reports understate the gravity of the situation, presumably for fear of being written off as alarmist.
The report usefully adds the other main greenhouse gases to give a CO2 equivalence figure:
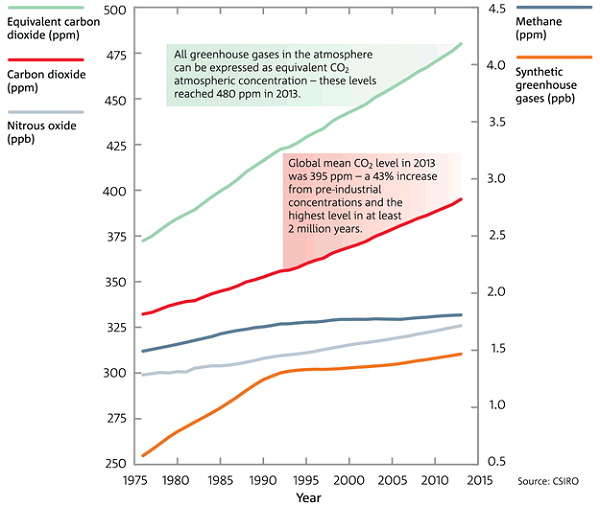
Please note the nitrous oxide and synthetic greenhouse gases are given in parts per billion.
In terms of CO2 equivalence we are now the 480 ppm. We should be red alerts everywhere and an emergency meeting of the G20, or something. The sad fact is that no policy agenda adopted by a political party has aspired to a safe climate. In fact the Garnaut Report and the Clean Energy Future Package legislated by Labor, the Greens and the indies, only ever aspired to 450 or 550 ppm CO2e. James Hansen in nominating 350 ppm as an initial target was very clear that this needed to assume net zero for the other greenhouse gases. What we are committed to now is a very unsafe climate as the effects play out in the short, mid and longer term.
Abbott was going to leave climate change off the forthcoming G20 agenda for Brisbane until the Americans complained.
Prospective temperature increases
Temperatures are projected to rise by 0.6 to 1.5°C by 2030 compared to the climate of 1980 to 1999. Warming by 2070 is projected to be 1.0 to 2.5°C for low greenhouse gas emissions and 2.2 to 5.0°C for high emissions.
We’ll achieve the upper bound if we continue as we are; the lower bound lacks credibility. To the ranges given we need to add 0.6°C in order to obtain the values for change since pre-industrial.
Again, we are clearly heading for dangerous climate change.
At time of writing there was a short piece in New Scientist citing three recent studies which indicate that climate sensitivity may have been under-estimated. Drew Shindell of NASA GISS:
“Sensitivity is not down at the low end,” Shindell says. “We can’t take any solace from warming being slower of late.”
That means we must cut our emissions fast, he says, or the planet could warm by 6°C by 2100.
Warming of 4°C is usually given as the level where civilisation as we know it comes into play. For Australia in a 4°C world, see Gabrielle Kuiper at Climate Code Red.
Hot days and heat waves
This graph shows the incidence of days in a year when the temperature is in the hottest 1% relative to 1910-2013:
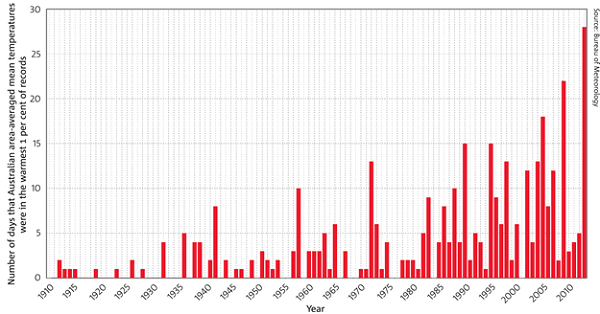
Graham Readfearn points out:
Starting from 1910 when Australia’s records start, it took 31 years for the country to rack up 28 days hot enough to fall into that top one per cent.
2013, however, managed to deliver this same number of extremely hot days in a single year.
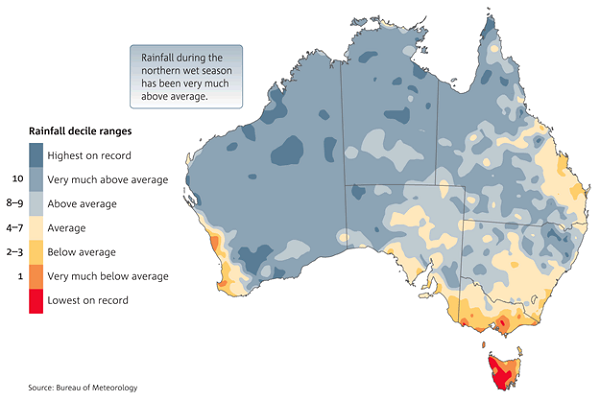
Precipitation changes
The following map shows the rainfall variation in deciles since 1995-1996 for the northern wet season of October to April:
The next map shows the rainfall variation in deciles since 1995-1996 for the southern wet season of April to November:
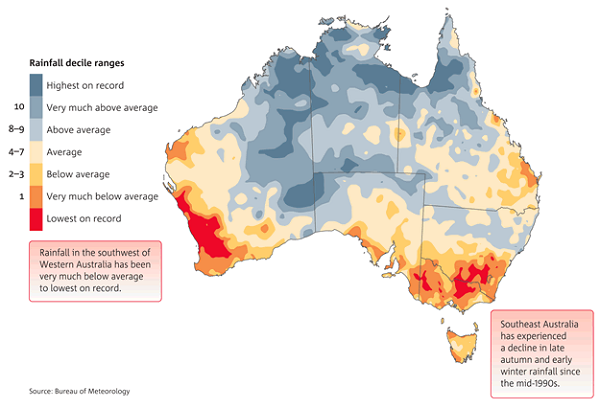
I believe that Sydney, which has dominant autumn/early winter rainfall, sits on the border between the summer and winter rainfall zones.
Clear patterns of change are becoming obvious. Apart from southern areas there is distinct drying in large tracts of Queensland, especially in winter.
This is disturbing:
The reduction in rainfall is amplified in streamflow in our rivers and streams. In the far southwest, streamflow has declined by more than 50 per cent since the mid-1970s. In the far southeast, streamflow during the 1997–2009 Millennium Drought was around half the long-term average.
Could be that we’ll increasingly have to rely on damaging floods to fill our dams.
Conclusion
There’s more, of course, including the prospect of losing our reef ecosystems.
Climate change is upon us.