
To set this up, the following is a graph of the temperature during the Holocene Era comes from a 2017 James Hansen publication, with explanatory enhancements by David Spratt:
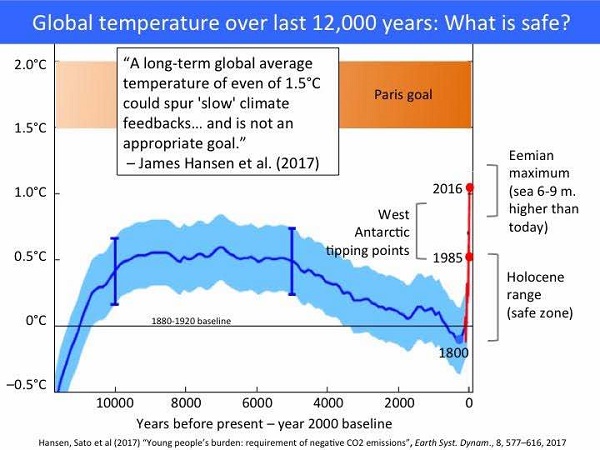
It was thought that both the Holocene and the Eemian, 130 to 118,000 years ago, experienced an early thermal maximum reflected in the big hump in the graph.
Research done by Samantha Bova et al Seasonal origin of the thermal maxima at the Holocene and the last interglacial gives quite a different picture, one of steady warming. This has important implications for where we are at with global warming.
If you click on the link in the Guardian article Climate crisis: world is at its hottest for at least 12,000 years – study the Nature article will open for you.
Bova’s team looked at fossil sea shells and algal compounds found in cores of ocean sediments, coming to two conclusions.
First, seasonal peaks had been mistaken for annual averages.
Secondly, cycles caused by the Earth’s orbital eccentricities can lead to summers becoming hotter and winters colder while average annual temperatures change only a little.
How this science works in detail is above my pay grade, but this Guardian graph was derived from their results:
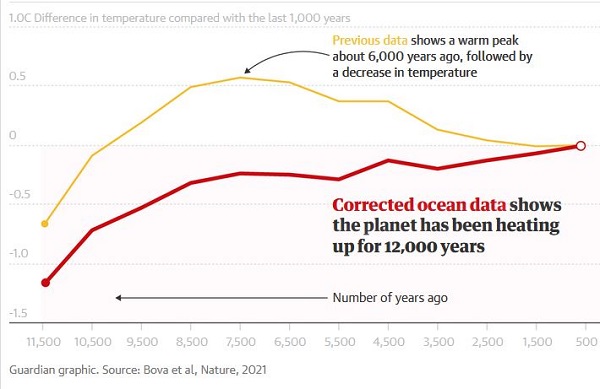
The thermal maximum thought to have existed 10 to 6,000 years ago, disappears in favour of steady warming.
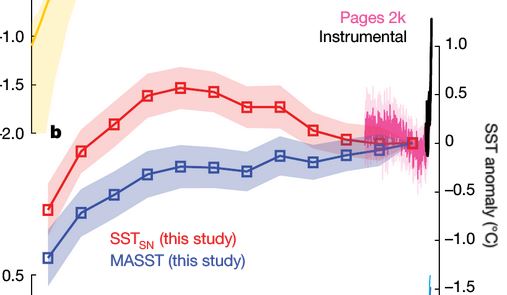
That graph cuts off the last 500 years, which are included in this screenshot extract from the article:
There are two main implications stemming from this research, as I see it.
Firstly, current global temperatures are about the same as the maximum temperatures reached in the Eemian.
This means that future equilibrium average global sea level rise is likely to be in the 6 to 9 metre range, if temperature stays the same as it is now. Not immediately of course. Equilibrium would be reached in centuries/millenia time scales.
However, Eemian temperatures and sea levels were reached with greenhouse gas levels much lower than now, at 300ppm, so the implications for sea level rise in forthcoming centuries are horrendous unless we dial down the atmospheric GHGs through drawdowns.
Secondly, the thermal maxima in the Holocene and Eemian had always been problematic to climate modellers. Models had always shown a steady increase rather than a hump.
The conflict between models and paleoclimate observations has been resolved in this research. This enhances confidence in both branches of climate science. However, it is but one study, and late in the cycle of gathering research for the next IPCC report. I’d be surprised if it made the cut, so the IPCC treatment of sea level forecasts, which has always been problematic, may continue to be so.
Finally, the graph from the article shows an angle more scary than Michael Mann’s original ‘hockey stick’. The black line represents the instrumental record.
Set in a 12,000-year context, what is happening in the industrial age is like hitting a wall, with implications for the capacity of the living planetary ecology to cope. As I point out in the Five graphs that matter, the system is being forced 30 times harder than it was coming out of the ice age 18 to 11,000 years ago.
Shortest post I’ve done for about a year!
I think the overall implication for climate action is, once again, it shows the folly of ever thinking that the planet could reach an acceptable temperature equilibrium state with CO2 concentrations in the region of 450ppm, which they will be if we go for zero net by 2050.
I’ll say again that in the early 1990s, when the IPCC and UNFCCC were set up to deal with climate change, CO2 concentrations had passed 350 ppm in September 1988. The state of knowledge at the time was that during the Eemian when concentrations were a mere 300ppm sea level was then thought to have been 3-5 metres higher than now.