
 Below I’ve set set out some of the main findings in the Summary for Policymakers (downloadable from here) from the IPCC’s Climate Change 2013: The Physical Science Basis before looking at what they say about the wriggle room remaining to us (ie. the ‘climate budget approach’) if we want to avoid dangerous climate change.
This post follows the introductory post Crisis or catastrophe? What will the IPCC say?
In this report they’ve set up a reference pattern which will be followed unless otherwise specified in the remaining volumes, so we’d better wrap our minds around it.
The basic concept is that of Representative Concentration Pathways (RCPs) which are expressed in terms of watts per square metre of radiative forcing (W m-2). So when looking at phenomena such as future temperature change or sea level rise there is no ‘business as usual’ (BAU) scenario. Four scenarios have been chosen – RCP2.6, RCP4.5, RCP6.0 and RCP8.5. These are described as, respectively, a mitigation scenario leading to a very low forcing level, two stabilisation scenarios and one scenario with very high greenhouse gas emissions. The last (RCP8.5) is perhaps the equivalent of BAU or a ‘no climate change policy’ scenario.
AR5 uses four time reference points, two past and two future – 1850-1900, 1986-2006, 2046-2065 and 2081-2100.
I have called 1850-1900 ‘pre-industrial’, while 1986-2005 is roughly ‘now’. It needs to be borne in mind that the 0.61C warming had already taken place from pre industrial times to 1986-2005. Looking forward 2046-2065 is ‘mid-century’ while 2080-2100 is roughly the end of the 21st century.
I’ve prepared a spreadsheet showing in the first column the prospective temperature rise from ‘now’ to the end of the 21st century. The second column adds in the warming from pre-industrial until ‘now’. Finally I’ve tabulated the increase from pre-industrial to mid-century. I’ve only quoted the mean values so that the signal doesn’t get lost in the noise.
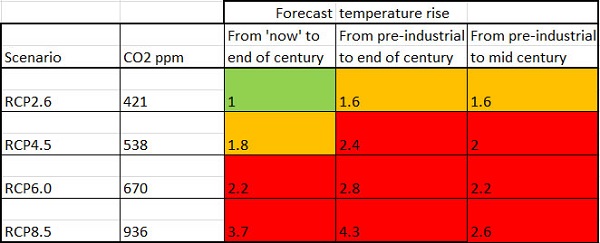
I’ve used green to indicate a comparatively ‘safe’ climate, orange to indicate the increasingly contested zone which clearly carries some danger, and red to indicate breaching the 2C guardrail which everyone with half a brain accepts as dangerous.
What needs to be emphasised here is the non-linearity of climate vulnerability and risk. As temperatures increase the potential for nasty surprises or ‘tipping points’ increases, but frankly we are already entering that zone.
Some points to note here. Firstly, the change from 1880 to 2012 (the real ‘now’) is given as 0.85C (0.65 to 1.06 with 90% certainty).
Secondly, while the CO2 levels are linked to certain watts per square metre in the RCPs the CO2 levels stand as a marker for all greenhouse gases. The RCPs don’t change if you additionally identify the MH4 and NO levels, as they are already included in the calculations.
This table from the report shows the forecast temperatures, plus sea level rise, with uncertainty ranges.
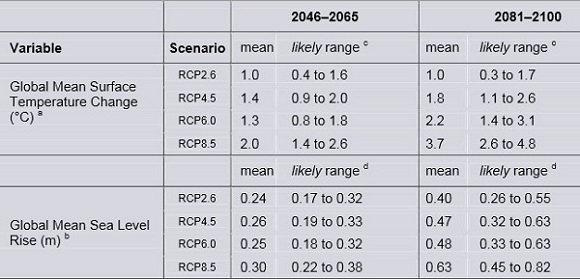
The uncertainty range is a bit narrower than it was in AR4 in 2007. Please note, the text actually gives the range for RCP8.5 as 0.52 to 0.98m.
If we discard RCP2.6 because it won’t happen the total range of prospective sea level rise is 32cm to 82cm, with medium confidence. A linear extrapolation of the current rate of 3.2mm pa will yield the lower bound of that range. Also we are told:
Confidence in projections of global mean sea level rise has increased since the AR4 because of the improved physical understanding of the components of sea level, the improved agreement of process-based models with observations, and the inclusion of ice-sheet dynamical changes.
Furthermore:
Based on current understanding, only the collapse of marine-based sectors of the Antarctic ice sheet, if initiated, could cause global mean sea level to rise substantially above the likely range during the 21st century. However, there is medium confidence that this additional contribution would not exceed several tenths of a meter of sea level rise during the 21st century.
Under RCP8.5, however, the annual rate of change by 2100 will be from 8mm to 16mm, with a mean nearly four times the current rate. Apart from RCP2.6 sea level rise will continue in subsequent centuries.
RenewEconomy has a simple summary of the report, which includes this on precipitation:
Changes in the global water cycle in response to the warming over the 21st century will not be uniform. The contrast in precipitation between wet and dry regions and between wet and dry seasons will increase, although there may be regional exceptions.
Evidence for human influence has strengthened since AR4. It is now considered extremely likely (formerly very likely) that human influence has been the dominant cause of the observed warming since the mid-20th century. Moreover,
There is high confidence that changes in total solar irradiance have not contributed to the increase in global mean surface temperature over the period 1986 to 2008, based on direct satellite measurements of total solar irradiance.
Here’s the graph of radiative forcing:

Here’s the historic graph for temperature rise, showing clearly that warming is still occurring:

Crisis or catastrophe – the climate budget crunch
Generally speaking, the 4C limit is said to be the point at which civilisation as we know it is threatened. Of relevance here, the AR5 document tells us that the near-complete melting of the Greenland ice sheet will occur, over a millennium or more, with a temperature rise of somewhere between 1C and 4C relative to pre-industrial.
The report still uses the guardrail of 2C temperature rise relative to 1861-1880 (Figure 2 shows that this would be similar to 1850-1900) in order to mark dangerous climate change. You’ll get plenty arguments about that. Bolivia, for example, wants to use 1C as the limit for a safe climate. In this post I noted that some developing countries sought a lower guardrail of 1.5C rather than 2C while the African civil society group Pan African Climate Justice Alliance (PACJA) wanted 1 to 1.5C.
David Spratt asks the question as to whether current levels of CO2 are already dangerous. His answer is unsettling, to say the least. What do our politicians think of the notion that we need to keep the temperature rise to less than 1.5C if we want to preserve more than 10% of corals worldwide?
He also found that during the Eemian 120,000 years ago we had three metres of sea level rise within 50 years with much gentler forcing than we have now, in probably the best analogue of what lies before us.
In a warming world what matters is the total quantum of CO2 in the atmosphere. The ‘climate budget approach’ identifies the total anthropogenic CO2 emitted to cause warming of 2C. For a 66% chance of staying under 2C the total CO2 emitted must not exceed 1000Gt, according to calculations done by Malte Meinshausen and others back in 2009. The later we leave cutting the harder we have to cut. Meinshausen’s article in Nature is paywalled, but this graph in an article by Stefan Rahmstorf (in German) gives the idea:

Rahmstorf’s text talks about 1000Gt of CO2 or about 1500GT of CO2 equivalent with other greenhouse gases for a 25% chance of staying within 2C. Forget the precise figures, it’s the pattern of peaking and subsequent reductions that matter.
Now, as Giles Parkinson reports, the carbon budget figures have taken a haircut to become 800Gt for a 66% chance of 2C when “accounting for non-CO2 forcings”. Problem is we’d already used up 543Gt of the budget by 2011.
Fiona Harvey at The Guardian tells us that the decision to put the numbers in the report was hard-won. There was concern they “would have political repercussions”. I think that was the intention!
Oliver Milman also at The Guardian, tells us that cuts of 10% per annum will now be necessary, though I can’t find that in the report. He doesn’t say from when. This graph, from the Climate Commission’s 2011 The Critical Decade report (the site is now down the crapper – my summary is here), shows 9% pa from 2020 for a 66% chance.

I suspect the new 10% is from 2015 or 2017.
The above graph is sourced from a substantial 2009 document (in German) produced by WBGU (The German Advisory Council on Global Change) making the case for a carbon budget approach. Of more use to us is their English summary which on page 5 outlines the steps to be taken to provide an equitable way forward. The high polluting countries should take urgent steps to reduce emissions. Developing countries are then given space to increase emissions before reducing. The strategy is captured in this graph:
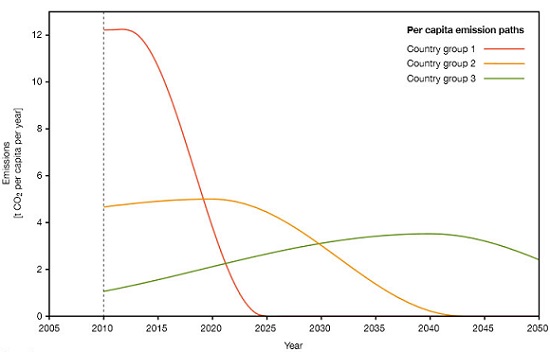
The red line represents the industrialised countries, green the developing countries. Newly industrialising countries such as China, Thailand and Mexico are represented by orange. With world-wide carbon trading (a world climate bank is proposed) the pattern would be varied along these lines:
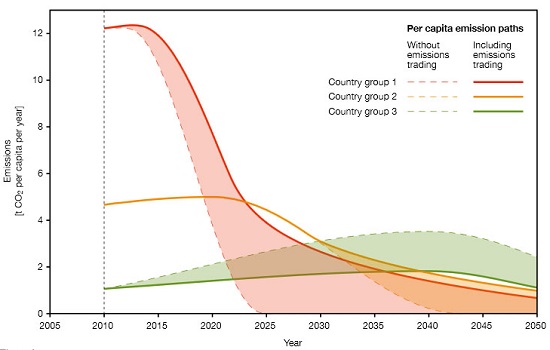
By 2100 all countries are allowed the same per capita emissions.
There is no doubt at all that the Germans and possibly the Europeans hoped for a deal along these lines from the UNFCCC meeting in Copenhagen in 2009. In the end a weak ‘contribute what suits you’ deal was cooked up in a small unofficial meeting that took place when President Obama went looking for his Chinese counterpart and found him ensconced with the leaders of India, Brazil, South Africa and others. The Europeans were not in the room. To say they were pissed off is an understatement. Nor was our man Rudd in the room, one of three leaders appointed to assist the Danish chair.
Now we have a deal to conclude a deal by 2015 within the UNFCCC framework, to be implemented from 2020. We’ve lost five years and the task is immensely harder.
Parkinson notes that our skinny remaining carbon budget means we can only afford to use about 10% of the world’s known fossil fuel reserves. But there is $4 trillion of shareholder value tied up in 200 listed companies in the industry carrying $1.5 trillion in loans. Writing down the value of that lot could break a few banks deemed too big to fail.
We’ve got a crisis for sure and a choice between two catastrophes.
It will be interesting to see what the mitigation working group comes up with. For my money, whatever they propose the Americans and the Chinese will not be pinned down to anything binding. In both cases their internal politics will not allow it.
The full WG1 report is now available. It’s 2126 pages long and they ask you not to quote it yet.
I outlined the budget approach in a post in January 2011:
Climate crunch: the fierce urgency of now.
This was a repost and update of one I did in May 2009, Climate crunch which linked to a special edition of Nature where I think an early version of the Potsdam climate budget approach was outlined.
The post Suffer the little children told the story of what happened in Copenhagen and beyond.
I’ve had no end of trouble with this post!
Yesterday I had an internet crash and when the system restored I’d lost three hours work. Then an earlier version of the Table 1 image became ‘sticky’ and insisted on reappearing even though I’d deleted it from the LP media library and my hard drive. Effectively it was an entirely different image with a different name from a separate screenshot .
Eventually I prepared the whole thing elsewhere in a secret place, deleted the LP draft and emptied the trash bin, then copied the final version back into LP.
Now it’s appearing on the front page after Saturday Salon and Lazy Sunday which have become sticky. It’s long, I know, but I hope you read it and appreciate it if you find it!
Brian, I stickied Salon and Sunday over the weekend purely to de-emphasise the new Overflow post. I’ll unsticky them ASAP.
Thanks tt. Unstuck now.
Stefan Rahmstorf solves the problem of the graph showing 82cm as the upper limit of sea level rise compares with 98cm in the text. It’s the last decade, the difference between 2080-2100 and 2100! Under RCP8.0 SLR will be accelerating rapidly according to forecasts.
Brian it’s great – thank you very much for all this work. You have alerted me to a lot of things including that the term ‘business as usual’ (which I have been using) doesn’t actually directly to anything in the report. Probably will keep using it as a handy form of shorthand but good to know what it nearest thing in the report to this. I’ve read the summary but not the full report (time!) so this is very useful.
I put some points about Australia on my last post on my blog – community focus, plain language (I already sent the link for that on your previous post but will put it here again – hope you don’t mind – http://fairgreenplanet.blogspot.com.au/2013/09/fifth-ipcc-report-we-need-to-act.html)
We’ve probably discussed this before but I think emphasising catastrophe – while I understand the thinking behind it – is potentially counter-productive. I will be doing some positive blogs about what it already being done – especially take up of solar at community level – soon and will post links here again. Also in my tweets for CAHA this week I am trying to emphasise some of the good work that’s going on as well as the very real dangers.
thanks again, great work
apologies for a whole load of typos! (won’t bother explaining them because I’m sure you can get the gist)
so for a positive message, as previously mentioned, this is something completely different – what one tiny community organisation is doing
http://fairgreenplanet.blogspot.com.au/2013/10/local-community-action-case-study.html
Val, thanks for the encouragement and for the links, especially the one about the Christ Church community Centre.
I’m all for being positive, but I also think we need to be clear-eyed about our situation. I see my audience not as politicians but as people who may influence others including politicians, people who want to know the truth about how things sit.
I did think about the term “catastrophe’. Back just before the 2010 election I did a post on Living in a 4C world. That to me would be a catastrophe.
I’m guessing about what would happen if you vapourised $4 trillion worth of shareholder value. My guess would be that if it happened with the speed it should then it would be at least equivalent to the GFC, but in a circumstance where the world has not yet recovered from the GFC. That qualifies as a catastrophe also, but not as grim as the 4C scenario.
BTW before I changed the title to fool the gremlins it was boring and descriptive!
I think it could definitely be catastrophic in so many ways. I guess that what the question becomes is what will make people act? I suppose because you and I are aiming at different audiences – you at people who can influence policy whereas I am aiming at health and community sector and community level.
In the health sector high level medical and public health people often talk in catastrophe terms eg ‘obesity crisis’ ‘tsunami of chronic disease’ etc – probably because they are trying to get politicians’ attention. While those of us working with people in their everyday lives are more likely to look for positive approaches instead of (or as well as) scare tactics.
One of the salutary examples is former labor government’s reaction to the extended drought in Victoria, where they got so panicked they built the desal plant – ridiculous costly white elephant adding to carbon pollution! Law of unintended consequences there perhaps.
You still believe a word the IPCC has to say?
[redacted]
I say we take off and vapourise the entire market from orbit. It’s the only way to be sure.
So did you see the report on what Greg Hunt said about the carbon price? http://bit.ly/1hhylQN
It’s Gregliar!
Val @ 12, for Hunt to take projected figures to ‘prove’ a historical fact is either grossly cynical or incompetent.
He can’t be that stupid, so he’s a liar.
Hans Joachim Schellnhuber, Director of the Potsdam Institute for Climate Impact Research and Co-Chair of the German Advisory Council on Global Change (WBGU), from a post back in February 2011:
He would have had in mind the graph in figure 5 above. Also:
I must admit that, when I first heard Hunt make those claims, I was surprised no one jumped on him about them. I didn’t think they could be true. Unfortunately, the journos who were interviewing him didn’t have the knowledge to contradict him, so he got away with it. It’s a shame that Combet seems to have taken himself out of the picture, as he’s probably the only person who really understands all this and can speak authoritatively about it. Hunt should be asked to go on Q&A by himself and be questioned by people who have a good understanding of this whole thing and can show him up for the fraud he is.
I watched the press conference live – Stocker (the Swiss Co-Chair of the WG1) was asked which pathway represented “business as usual” and he answered: ‘we could fairly be described as above all those contained in the report.’ Implying we are above even RCP 8.5 / 4.8C by the end of the century. So I don’t mean to emphasise catastrophe Val but calling RCP 8.5 BAU might not be right!
He was then pushed on this by another journo and realised his mistake and said, ‘they are projected pathways so we are not on any one of them and our policy decision will decide where we end up’ – back on message!
The abc fact check thing just did a number on Hunt’s figures.
I don’t expect anyone in the MSM to question them tho cos up until now they’ve proved themselves completely incompetent.
Anyway here’s the Google search for the terms Carbon emissions drop. Those links suggest the Carbon “tax” “worked” in that it helped lower emissions.
alexinbogota @ 16, that’s very interesting. There are a few who speak frankly, such as James Hansen (now retired) and John Schellnhuber. He (JS) does provide advice directly to Angela Merkel, who would understand him perfectly, but then there’s political reality to deal with.
In some ways the frankest in Kevin Anderson who heads up the Tyndall Centre. See for example this jumpy video I watched tonight Real Clothes for the Emperor (pdf of slides here).
He reckons we’ll have emissions of cumulative 3000Gt by 2050 and we are heading for 6C. He says 4C is “incompatible with an organised global community”.
He thinks about the best we can do is have OECD countries peak by 2020 and non-OECD by 2025. Then we need -10% pa to reach -90% by 2030. That’s for a 67% chance of staying within 2C, which is no picnic. Peaking earlier is simply unrealistic in terms of power stations, infrastructure etc
Yes, Anderson is very good, he also called out Pachauri’s ridiculous suggestion that the use of markets could possibly keep us within the 2C budget (http://www.independent.co.uk/environment/climate-change/plan-to-use-financial-markets-to-halt-climate-change-is-doomed-8852011.html)
I agree that 2020/2025 are what we’ll have to settle for but I am optimistic that once we get the transition going it will be easier than currently thought to get to 10% p.a…. Imagine we’re going over a hill and we’re just under the top and so it seems steep, but once we’re on the otherside it’s all downhill? Well one’s gotta hope!
One of the salutary examples is former labor government’s reaction to the extended drought in Victoria, where they got so panicked they built the desal plant – ridiculous costly white elephant adding to carbon pollution! Law of unintended consequences there perhaps.