Tag Archives: climate ‘budget’ approach

Carbon pricing: a dangerous distraction?

It is almost axiomatic to say that the mitigation necessary for 2°C limit to warming is best delivered through market-based instruments (MBIs) – where a price is placed on each tonne of carbon dioxide emitted.

Dissenter-in-chief is Kevin Anderson, professor of energy and climate change at the University of Manchester and deputy director of the Tyndall Centre, the UK’s leading academic climate change research organisation:

I hold that such an approach is doomed to failure and is a dangerous distraction from a comprehensive regulatory and standard based framework (within which price mechanisms may play a niche role).

Crucial in making this judgement is the notion that the mitigation rates are not marginal. We don’t need to knock off just one or two percent of emissions each year. We need, says Anderson, a whopping 10% per annum.

That seems extraordinary, but I’ll repeat here three graphs I’ve used before. They all come from 2009, the last two from The Copenhagen Diagnosis.

First we have Hans Joachim Schellnhuber’s estimate of the reductions needed using the ‘budget approach’, whereby the budget of permissible emissions is divided between countries on a per capita basis, and then the stabilisation path plotted given their existing per capita emissions levels:

2C trajectories Schellnhuber

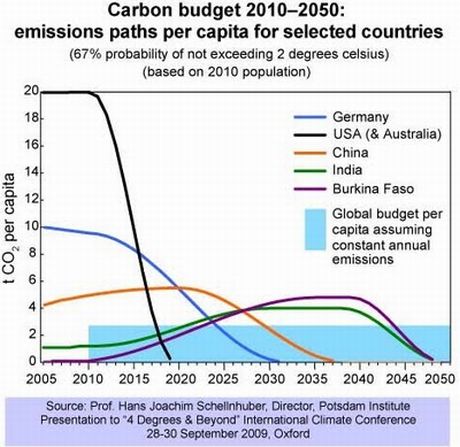
Anderson variously says the ‘we’ need to reduce emissions by 80 to 90% by 2030 and to zero soon thereafter. I think he is referring to the UK, which would have a similar stabilisation path to Germany. Note that Schellnhuber is basing these trajectories on only a 67% chance of keeping warming within the 2°C limit.

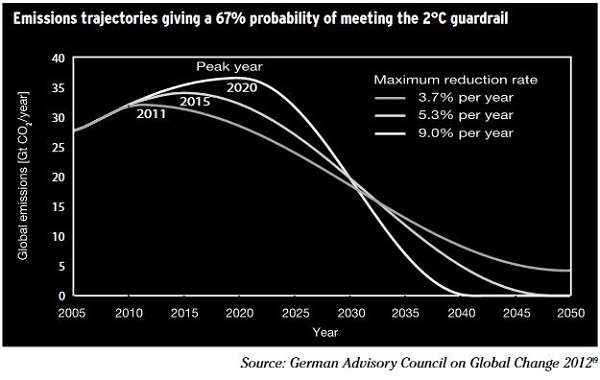
In the second graph the stabilisation path for the whole world is calculated, given different peaking dates:

Copenhagen diagnosis Fig 22 n

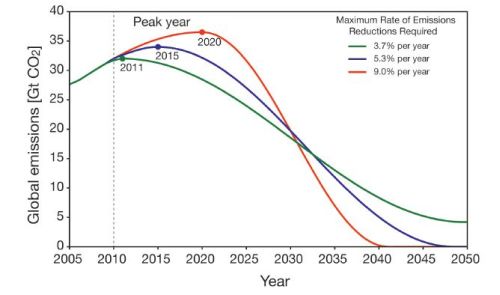
That shows a 9% per annum reduction required to reach zero about 2040 with peaking in 2020. In those terms Anderson’s 10% figure is in the ball park.

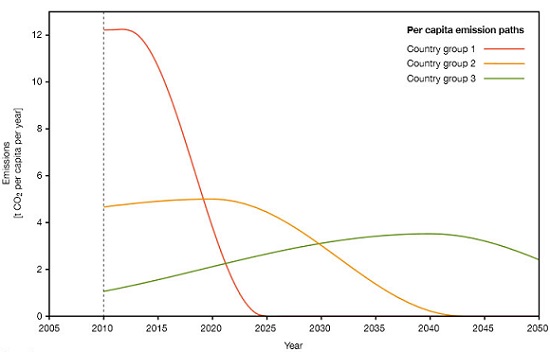
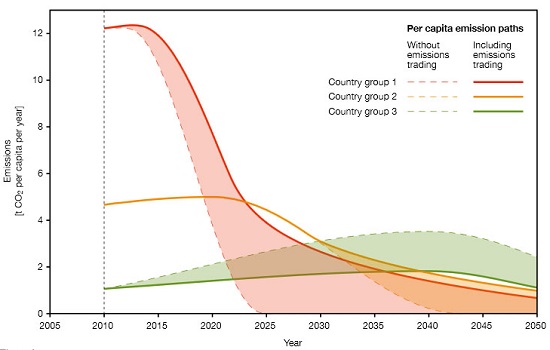
The third graph shows how the trajectories could be varied if countries were grouped into three categories, roughly advanced industrial countries, developing countries and in the middle newly industrialising countries. Carbon trading between them is assumed:

Budget approach with emissions trading_cropped_600

This too is a dangerous distraction. While rational it assumes that China, India and the US will commit themselves to definite reduction paths through international agreement. It’s simply not politically feasible.

I think Anderson is in the right ball park. His argument is that MBIs work fine when the reductions required are marginal. If you crank them up to get the result required a very high price will result. The rich will pay and continue to pollute while the poor will be devastated.

Anderson doesn’t discuss compensation, as was built into the Australian scheme, but pricing and compensation on the scale required is probably not politically feasible.

Anderson favours a regulatory or standards-based approach and gives these examples:

  • Strict energy/emission standards for appliances with a clear long-term market signal of the amount by which the standards would annually tighten; e.g. 100gCO2/km for all new cars commencing 2015 and reducing at 10% each year through to 2030
  • Strict energy supply standards; e.g. for electricity 350gCO2/kWh as the mean emissions level of a suppliers’ portfolio of power stations; tightened at ~10% p.a.
  • A programme of rolling out stringent energy/emission standards for industry equipment
  • Stringent minimum efficiency standards for all properties for sale or rent
  • World leading low-energy standards for all new-build houses, offices etc.
  • Moratorium on airport expansion
  • Technological and operational standards for shipping operating in UK waters
  • A suite of iterative mechanisms to counter, or at least alleviate, issues of rebound; this may include price mechanisms, progressive metering tariffs, etc.
  • Revisit the viability of Personal Carbon Trading as a mechanism for improving societal engagement in non-marginal change
  • Appoint a senior minister with the principal responsibility for maintaining an equitable transition to a low-carbon society

Taking the first two, rather than standards for appliances, I would focus on making stationary electricity supply renewable as an urgent task through direct action. Other than that all the ideas are grist to the mill, but I like John Wiseman’s approach as outlined in the post Climate change: reconnecting politics with reality which concentrates on the necessary political and institutional actions to be taken. After a priministerial announcement he recommends:

Then we would need an Australian Climate Solutions Act which set up the targets, the structures and the priority actions. Principal amongst these would be an Australian Climate Solutions Taskforce chaired by the Prime Minister and drawing from state and local governments, business, trade unions and community organisations.

Then we would need six key action plans.

First, an Australian Renewable Energy Plan to achieve 100 per cent renewable energy within 10 years.

Second, an Australian Economic Electrification Plan with initial priorities including a modal shift in passenger and freight transport from road to rail; the rapid replacement of fossil fuel based cars with electric vehicles; and the full electrification of household and industry heating and cooling.

Third, an Australian Energy Efficiency Plan that identifies the regulatory, planning, educational and financial initiatives that could achieve the overall goal of a rapid transition to a zero waste economy.

Fourth, an Australian Sustainable Consumption Strategy.

Fifth, an Australian Sustainable Agriculture and Forestry Plan designed to reduce land-based emissions and increase carbon sequestration.

Finally, state and local governments, community sector and business organisations would collaborate to develop and implement a comprehensive, long-term Australian Climate Change Adaptation and Resilience Plan.

I applaud the priority Wiseman gives to an Australian Renewable Energy Plan to achieve 100 per cent renewable energy within 10 years.

Carbon pricing similar to the Australian scheme may be one of a suite of actions to send a message and raise funds, but climate action on the scale now required compels us to address the issues much more directly. Overall my aim for the planet would be to reduce atmospheric CO2 to 350 ppm by 2050, for a safe climate. Well, as safe as it ever gets.

A failure of ambition: the UNEP Emissions Gap Report:

Cover_cropped_175

The United Nations Environment Programme (UNEP) has published its Emissions Gap Report 2014 a couple of weeks before the UN Conference on Climate Change in Lima, Peru. The latter is the annual UNFCCC Conference of Parties (COP), the penultimate one before the 2015 conference in Paris where, with a bit of luck, legally binding medium and long-term targets will be set for each country for emissions reduction. Each year since Copenhagen in 2009 the UNEP has reported on the gap between explicit pledges made by member states and what is required to have a likely (67%) chance of the planet staying within the 2°C guardrail. This is a necessary activity, because since Copenhagen each country determines its own targets within a framework of “common but differentiated responsibility”, which is a bunch of words that effectively allow each country to do as it pleases.

Someone needs to keep a tally as to what all this voluntary activity adds up to. UNEP had taken on that role.

The UNEP report takes note of and is broadly consistent with the IPCC Synthesis Report. Hence it accepts the IPCC ‘budget approach’ which states that we have already emitted 1,900 gigatonnes of carbon dioxide (Gt CO2) from an allowable budget of 2900 Gt since the dawn of the industrial era, leaving an estimated remaining budget of just 1,000 gigatonnes of carbon dioxide (Gt CO2). That’s roughly 20 years worth of emissions at the current rate.

Whereas the IPCC has given a range of scenarios, (scientists giving a range of options to policy makers) the UNEP has plotted just one which sees us peaking within about 10 years, halving CO2 emissions by 2050 and reaching net zero thereafter, they say between 2055 and 2070.

Net zero implies that some remaining CO2 emissions could be compensated by the same amount of carbon dioxide uptake, or ‘negative’ emissions, so long as the net input to the atmosphere due to human activity is zero, the report finds.

Because this scenario involves overshoot we will have to have net negative emissions during the last decades of the century. The less we act now the harder it gets later, as illustrated here:

Carbon neutrality_cropped_600

Hopefully this will sink into the brains of those attending the Lima conference, and more importantly the brains of their masters back home.

UNEP have done the sums and find that emissions in 2020 should not be higher than 44Gt CO2e to have a 67% chance of staying within
the 2°C target. If countries honour their current pledges we are heading for 52–54 Gt CO2e in 2020, leaving a gap of 8–10 Gt CO2e.

UNEP then looked at whether countries were on track to honour their pledges.

After reviewing available evidence from the G20 (with the EU 28 taken as a group) it appears that five parties to the United Nations Framework Convention on Climate Change – Brazil, China, the EU28, India and the Russian Federation – are on track to meet their pledges. Four parties – Australia, Canada, Mexico and the USA – are likely to require further action and/or purchased offsets to meet their pledges, according to government and independent estimates of projected national emissions in 2020. Conclusions are not drawn for Japan, the Republic of Korea, Indonesia and South Africa because of various uncertainties, nor for Argentina, Turkey and Saudi Arabia because they have not proposed pledges.

In 2010 we were at 49Gt CO2e; in 2020 we are likely to be at 55 Gt CO2e. The broad situation out to 2030 is represented as follows:

Emissions gap_cropped_600

I take it that our current form will get us to 56 to 59 Gt CO2e (grey), whereas we should at the very least be at 42 Gt CO2e (in the orange zone).

The gap is still widening.

There are several comments that need to be made.

First, the UNEP calculations would not have taken on board the China-US agreement. As stated in that post, Climate Interactive worked out that if other countries matched the US-China effort the following stabilisation scenario would ensue:

China-deal-600

For the first time we have a prospect of peaking emissions, but this does not come within a bulls roar of zero emissions in the second half of this century. The current level of ambition is lamentably lacking.

Secondly, and admirably, the UNEP report takes into account all greenhouse gases from all sources, calculated in terms of CO2 equivalent. Too often scientific reporting is limited to fossil fuel emissions.

Thirdly, the report is conceived within a framework that is irresponsible, bordering insane. A 67% chance of not breaching the 2°C guardrail represents lousy odds when we are dealing with the viability of major ecosystems on the planet and the future of civilisation.

The 2°C guardrail itself is now clearly inappropriate, when, for example as I explained in this post and elsewhere that preserving more than 10% of coral reefs worldwide in 2100 would require limiting warming to below 1.5°C.

The World Bank report Turn down the heat contains examples like this:

In Brazil, at 2°C warming, crop yields could decrease by up to 70 percent for soybean and up to 50 percent for wheat.

The scientists from the Potsdam Institute for Climate Impact Research and Climate Analytics who put that report together for the World Bank are telling it like it is. Sadly the international array of scientists and others involved in the UNEP report (plenty of Germans but none I can see from Potsdam) are making concessions to what they think will be politically acceptable and doable, as, unfortunately, does the IPCC report.

The stakes are too high for such dissembling diplomacy!

Update: Len @ 1 asked:

It would be nice to at least know what level of action is needed to reach a 95% level surety. Is this stated anywhere?

Back in 2008 James Hansen told us that we had already overshot and that in the first instance we should get concentration levels down to 350 CO2e. Hower, he seems to be about a decade ahead of the bulk of the scientific/political community concerned with climate change. The 2°C guardrail had been invented by the Germans in the 1990s and was accepted by the UNFCCC process as a desirable aim in Copenhagen in 2009. Since then it has become the ‘widely accepted standard’ we should aim at. As such it provides the framework within most climate mitigation scientists work.

The IPCC Fifth Assessment report (AR5) (my post on the Synthesis Report here – see second table) did not look at stabilisation scenarios aiming at less than 450 ppm CO2e. They have a column for <430 but didn't fill it in, because of a lack of studies in the scientific record. The IPCC relies on studies in the scientific literature, with a cutoff of about December 2012, and insufficient studies were available for them to fill in the numbers. So the failure is with the scientific community, sadly. I can give you two pointers. The first is this wondrous graph which I first picked up in The Climate Authority Review of targets:

Stabilisation probabilities_croppedb_580

The graph has Malte Meinshausen’s name on it. He was at the time at the Potsdam Institute, I believe he is now at the University of Melbourne. His work is excellent.

From the graph you can see that 350 ppm will only get you about a 95% chance of staying below 2.5°C, not 2°C.

If you want a 1.5°C climate you need about 320 ppm. We are currently at 480 ppm CO2e.

It is notable that David Spratt and Philip Sutton wrote in 2008 that we should be aiming at 320 ppm. Spratt blogs at Climate Code Red, where under Publications you will find a book by the same name which was originally published online in 2008 as The Big Melt written in response to the astonishing Arctic melting in 2007, since easily surpassed in 2012. Spratt is a science writer rather than a scientist, and consistently publishes critiques of the mainstream approach, as I picked up, for example in The game is up, where he says:

We have to come to terms with two key facts: practically speaking, there is no longer a “carbon budget” for burning fossil fuels while still achieving a two-degree Celsius (2°C) future; and the 2°C cap is now known to be dangerously too high.

He concludes that there is no longer a non-radical option, only one path remains viable: the emergency ‘war economy’ mode.

Climate Code Red identifies practical strategies we need to adopt.

The Australian group Beyond Zero Emissions consistently publish material on rapid decarbonistaion. My mate John Davidson has investigated them more than I have and regards them as sound. I hope to post on one of their reports soon.

Elsewhere Kevin Anderson from the UK is worth keeping an eye on. See his personal site and Real clothes for the emperor.

Professor John Wiseman, Deputy Director of the Melbourne Sustainable Society Institute at the University of Melbourne looked at the shape of climate policy for the future for the Centre for Policy Development. See Climate change: reconnecting politics with reality. He has an appropriate sense of urgency and sets out the specific strategies we need to adopt in Australia for rapid decarbonisation. He, for example, sees the need for 100% renewables in 10 years.

People like Spratt, Anderson, Wiseman and BZE are all looking for “the achievement of emission reductions at the necessary scale and speed [which] will require transformational rather than incremental change”. The war analogy is not inappropriate. Abbott would have us fiddle while Rome burns. His approach is essentially one of tokenism. You run a climate mitigation program off to one side in order to have one on your books, at the least expense you can get away with. It’s essentially a sop to the electorate which doesn’t interrupt your central vision of the generation of wealth based centrally on the fossil fuel industry.

This is delusional – see The folly of Galilee basin coal.

The game is up

In the post A choice of catastrophes: the IPCC budget approach I explained the socalled ‘carbon budget approach’ in some detail. In general terms:

    In a warming world what matters is the total quantum of CO2 in the atmosphere. The ‘climate budget approach’ identifies the total anthropogenic CO2 emitted to cause warming of 2°C. For a 66% chance of staying under 2°C the total CO2 emitted must not exceed 1000Gt, according to calculations done by Malte Meinshausen and others back in 2009. The later we leave cutting the harder we have to cut.

Rahmstorf’s budget was about 1000Gt of CO2 or about 1500GT of CO2 equivalent with other greenhouse gases for a 25% chance of staying within 2°C. Then

    as Giles Parkinson reports, the carbon budget figures have taken a haircut to become 800Gt for a 66% chance of 2°C when “accounting for non-CO2 forcings”. Problem is we’d already used up 543Gt of the budget by 2011.

David Spratt now tells it straight: Continue reading The game is up

Climate Change Authority review

In late February the Climate Change Authority published a Draft Report of its Targets and Progress Review.

The full draft report (all 265 pages) is downloadable from the first link above. Unfortunately I don’t have time to read all of it. Clive Hamilton at The Conversation has written an excellent overview. Continue reading Climate Change Authority review

Climate change: reconnecting politics with reality

After the rally on Sunday 17 November Ben Eltham took a look at climate activism in the digital age and nominated climate policy as “the central battleground of 21st century politics.” Sooner or later, somehow or other, climate activism has to be turned into real politics. As one of the ten themes in the Centre for Policy Development’s Pushing our Luck: ideas for Australian progress Professor John Wiseman, Deputy Director of the Melbourne Sustainable Society Institute at the University of Melbourne looked at the shape of climate policy for the future.

You can find his whole piece at page 142 on the pdf counter, but I’ll attempt to give a brief outline here.

First he surveys the science, our prospects and the risks. The risk of a 4C future is unacceptably high. He quotes the World Bank’s report Turn Down the Heat:

    ‘Even with the current mitigation commitments and pledges fully implemented there is roughly a 20 per cent likelihood of exceeding 4°C by 2100. If they are not met warming of 4°C could occur as early as the 2060s.’

What does 4°C mean?

    Professor John Schellnhuber, Director of the Potsdam Institute for Climate Impact Research, provides a stark assessment of the difference between a rise of two and four degrees. ‘The difference,’ he says, ‘is human civilisation. A 4°C temperature increase probably means a global [population] carrying capacity below 1 billion people’.

He then looks at the climate budget approach and posts a version of this now familiar graph:

He concludes that we need more ambition and urgency, both at the national and international levels. The achievement of emission reductions at the necessary scale and speed will require transformational rather than incremental change. Continue reading Climate change: reconnecting politics with reality

A choice of catastrophes: the IPCC budget approach

wg1cover_175
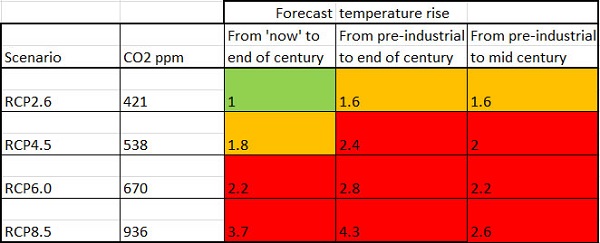
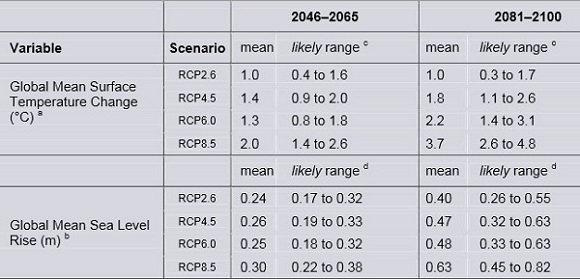
Below I’ve set set out some of the main findings in the Summary for Policymakers (downloadable from here) from the IPCC’s Climate Change 2013: The Physical Science Basis before looking at what they say about the wriggle room remaining to us (ie. the ‘climate budget approach’) if we want to avoid dangerous climate change.

This post follows the introductory post Crisis or catastrophe? What will the IPCC say?

In this report they’ve set up a reference pattern which will be followed unless otherwise specified in the remaining volumes, so we’d better wrap our minds around it.

The basic concept is that of Representative Concentration Pathways (RCPs) which are expressed in terms of watts per square metre of radiative forcing (W m-2). So when looking at phenomena such as future temperature change or sea level rise there is no ‘business as usual’ (BAU) scenario. Four scenarios have been chosen – RCP2.6, RCP4.5, RCP6.0 and RCP8.5. These are described as, respectively, a mitigation scenario leading to a very low forcing level, two stabilisation scenarios and one scenario with very high greenhouse gas emissions. The last (RCP8.5) is perhaps the equivalent of BAU or a ‘no climate change policy’ scenario.

AR5 uses four time reference points, two past and two future – 1850-1900, 1986-2006, 2046-2065 and 2081-2100.

I have called 1850-1900 ‘pre-industrial’, while 1986-2005 is roughly ‘now’. It needs to be borne in mind that the 0.61C warming had already taken place from pre industrial times to 1986-2005. Looking forward 2046-2065 is ‘mid-century’ while 2080-2100 is roughly the end of the 21st century.

I’ve prepared a spreadsheet showing in the first column the prospective temperature rise from ‘now’ to the end of the 21st century. The second column adds in the warming from pre-industrial until ‘now’. Finally I’ve tabulated the increase from pre-industrial to mid-century. I’ve only quoted the mean values so that the signal doesn’t get lost in the noise.

Figure 1: RCP temperature scenarios

I’ve used green to indicate a comparatively ‘safe’ climate, orange to indicate the increasingly contested zone which clearly carries some danger, and red to indicate breaching the 2C guardrail which everyone with half a brain accepts as dangerous.

What needs to be emphasised here is the non-linearity of climate vulnerability and risk. As temperatures increase the potential for nasty surprises or ‘tipping points’ increases, but frankly we are already entering that zone.

Some points to note here. Firstly, the change from 1880 to 2012 (the real ‘now’) is given as 0.85C (0.65 to 1.06 with 90% certainty).

Secondly, while the CO2 levels are linked to certain watts per square metre in the RCPs the CO2 levels stand as a marker for all greenhouse gases. The RCPs don’t change if you additionally identify the MH4 and NO levels, as they are already included in the calculations.

This table from the report shows the forecast temperatures, plus sea level rise, with uncertainty ranges.

Table 2: RCP scenarios for temperature and sea level rise
Table 2: RCP scenarios for temperature and sea level rise___

The uncertainty range is a bit narrower than it was in AR4 in 2007. Please note, the text actually gives the range for RCP8.5 as 0.52 to 0.98m.

If we discard RCP2.6 because it won’t happen the total range of prospective sea level rise is 32cm to 82cm, with medium confidence. A linear extrapolation of the current rate of 3.2mm pa will yield the lower bound of that range. Also we are told:

Confidence in projections of global mean sea level rise has increased since the AR4 because of the improved physical understanding of the components of sea level, the improved agreement of process-based models with observations, and the inclusion of ice-sheet dynamical changes.

Furthermore:

Based on current understanding, only the collapse of marine-based sectors of the Antarctic ice sheet, if initiated, could cause global mean sea level to rise substantially above the likely range during the 21st century. However, there is medium confidence that this additional contribution would not exceed several tenths of a meter of sea level rise during the 21st century.

Under RCP8.5, however, the annual rate of change by 2100 will be from 8mm to 16mm, with a mean nearly four times the current rate. Apart from RCP2.6 sea level rise will continue in subsequent centuries.

RenewEconomy has a simple summary of the report, which includes this on precipitation:

Changes in the global water cycle in response to the warming over the 21st century will not be uniform. The contrast in precipitation between wet and dry regions and between wet and dry seasons will increase, although there may be regional exceptions.

Evidence for human influence has strengthened since AR4. It is now considered extremely likely (formerly very likely) that human influence has been the dominant cause of the observed warming since the mid-20th century. Moreover,

There is high confidence that changes in total solar irradiance have not contributed to the increase in global mean surface temperature over the period 1986 to 2008, based on direct satellite measurements of total solar irradiance.

Here’s the graph of radiative forcing:

Figure 1: Radiative forcing drivers
Figure 1: Radiative forcing drivers___

Here’s the historic graph for temperature rise, showing clearly that warming is still occurring:

Figure 1: Land and ocean surface temperature anomaly 1850-2012
Figure 2: Land and ocean surface temperature anomaly 1850-2012

Crisis or catastrophe – the climate budget crunch

Generally speaking, the 4C limit is said to be the point at which civilisation as we know it is threatened. Of relevance here, the AR5 document tells us that the near-complete melting of the Greenland ice sheet will occur, over a millennium or more, with a temperature rise of somewhere between 1C and 4C relative to pre-industrial.

The report still uses the guardrail of 2C temperature rise relative to 1861-1880 (Figure 2 shows that this would be similar to 1850-1900) in order to mark dangerous climate change. You’ll get plenty arguments about that. Bolivia, for example, wants to use 1C as the limit for a safe climate. In this post I noted that some developing countries sought a lower guardrail of 1.5C rather than 2C while the African civil society group Pan African Climate Justice Alliance (PACJA) wanted 1 to 1.5C.

David Spratt asks the question as to whether current levels of CO2 are already dangerous. His answer is unsettling, to say the least. What do our politicians think of the notion that we need to keep the temperature rise to less than 1.5C if we want to preserve more than 10% of corals worldwide?

He also found that during the Eemian 120,000 years ago we had three metres of sea level rise within 50 years with much gentler forcing than we have now, in probably the best analogue of what lies before us.

In a warming world what matters is the total quantum of CO2 in the atmosphere. The ‘climate budget approach’ identifies the total anthropogenic CO2 emitted to cause warming of 2C. For a 66% chance of staying under 2C the total CO2 emitted must not exceed 1000Gt, according to calculations done by Malte Meinshausen and others back in 2009. The later we leave cutting the harder we have to cut. Meinshausen’s article in Nature is paywalled, but this graph in an article by Stefan Rahmstorf (in German) gives the idea:

Figure 3: Meinshausen's emissions reduction options
Figure 3: Meinshausen’s emissions reduction options

Rahmstorf’s text talks about 1000Gt of CO2 or about 1500GT of CO2 equivalent with other greenhouse gases for a 25% chance of staying within 2C. Forget the precise figures, it’s the pattern of peaking and subsequent reductions that matter.

Now, as Giles Parkinson reports, the carbon budget figures have taken a haircut to become 800Gt for a 66% chance of 2C when “accounting for non-CO2 forcings”. Problem is we’d already used up 543Gt of the budget by 2011.

Fiona Harvey at The Guardian tells us that the decision to put the numbers in the report was hard-won. There was concern they “would have political repercussions”. I think that was the intention!

Oliver Milman also at The Guardian, tells us that cuts of 10% per annum will now be necessary, though I can’t find that in the report. He doesn’t say from when. This graph, from the Climate Commission’s 2011 The Critical Decade report (the site is now down the crapper – my summary is here), shows 9% pa from 2020 for a 66% chance.

Figure 4: Emissions reduction options

I suspect the new 10% is from 2015 or 2017.

The above graph is sourced from a substantial 2009 document (in German) produced by WBGU (The German Advisory Council on Global Change) making the case for a carbon budget approach. Of more use to us is their English summary which on page 5 outlines the steps to be taken to provide an equitable way forward. The high polluting countries should take urgent steps to reduce emissions. Developing countries are then given space to increase emissions before reducing. The strategy is captured in this graph:

Figure 5: The climate budget approach

The red line represents the industrialised countries, green the developing countries. Newly industrialising countries such as China, Thailand and Mexico are represented by orange. With world-wide carbon trading (a world climate bank is proposed) the pattern would be varied along these lines:

Figure 6: The carbon budget approach with carbon trading

By 2100 all countries are allowed the same per capita emissions.

There is no doubt at all that the Germans and possibly the Europeans hoped for a deal along these lines from the UNFCCC meeting in Copenhagen in 2009. In the end a weak ‘contribute what suits you’ deal was cooked up in a small unofficial meeting that took place when President Obama went looking for his Chinese counterpart and found him ensconced with the leaders of India, Brazil, South Africa and others. The Europeans were not in the room. To say they were pissed off is an understatement. Nor was our man Rudd in the room, one of three leaders appointed to assist the Danish chair.

Now we have a deal to conclude a deal by 2015 within the UNFCCC framework, to be implemented from 2020. We’ve lost five years and the task is immensely harder.

Parkinson notes that our skinny remaining carbon budget means we can only afford to use about 10% of the world’s known fossil fuel reserves. But there is $4 trillion of shareholder value tied up in 200 listed companies in the industry carrying $1.5 trillion in loans. Writing down the value of that lot could break a few banks deemed too big to fail.

We’ve got a crisis for sure and a choice between two catastrophes.

It will be interesting to see what the mitigation working group comes up with. For my money, whatever they propose the Americans and the Chinese will not be pinned down to anything binding. In both cases their internal politics will not allow it.

The full WG1 report is now available. It’s 2126 pages long and they ask you not to quote it yet.

I outlined the budget approach in a post in January 2011:
Climate crunch: the fierce urgency of now.

This was a repost and update of one I did in May 2009, Climate crunch which linked to a special edition of Nature where I think an early version of the Potsdam climate budget approach was outlined.

The post Suffer the little children told the story of what happened in Copenhagen and beyond.

Climate clippings 60: 2011 review edition

The year in review

For me the year began with the post Climate crunch: the fierce urgency of now, wherein we were reminded that the time for significant action on climate change was now and that postponing such action would make things quite a lot harder.

This message was reinforced by the Climate Commission’s report The Critical Decade with the following message:

“This decade is critical. Unless effective action is taken, the global climate may be so irreversibly altered we will struggle to maintain our present way of life.” “Without strong and rapid action there is a significant risk that climate change will undermine our society’s prosperity, health, stability and way of life.

Continue reading Climate clippings 60: 2011 review edition

Climate crunch time arrives

Three emission reduction trajectories

The Climate Commission has just released its first report (download from here) entitled The Critical Decade: Climate science, risks and responses. The report is clear, simple and succinct with excellent illustrations.

If you want to cut to the chase, the message is encapsulated in the highlighted graph. If we, the world, start to reduce emissions now (impossible) by 3.7% a year, we can get away with an eventual reduction of about 85% by 2050. If we start reducing emissions in 2020 we’ll need to reduce by 9% each year (impossible). If we start in 2015 we can get away with reductions of 5.3% per year (barely possible). But we will have to reach zero net emissions by 2040 and then go negative. Is that possible? Barely, if at all, I suspect. Continue reading Climate crunch time arrives

Climate crunch: the fierce urgency of now

In November 2009, in the run up to the Copenhagen conference I published a post Climate crunch and Copenhagen: the fierce urgency of now. (Link no longer available.) For my first climate change post in 2011 I’ve reposted most of that post, with slight variations, and leaving out the direct commentary on Copenhagen.

My intention is to remind people that action on climate change is urgent, and that there is a severe penalty in leaving action to a later date.

Substantively the post outlines the carbon budget approach to climate stabilisation which gives prime place to carbon equity. If Australia wants to show leadership in climate change internationally we should seek zero net emissions by 2030. We would still blow our equitable carbon budget which requires zero emissions by 2019, but with that kind of leadership we should get away with it. Also we should use our land and our forests to create carbon sinks in order to then go negative in net emissions.

The reprised post is below the fold. Continue reading Climate crunch: the fierce urgency of now