

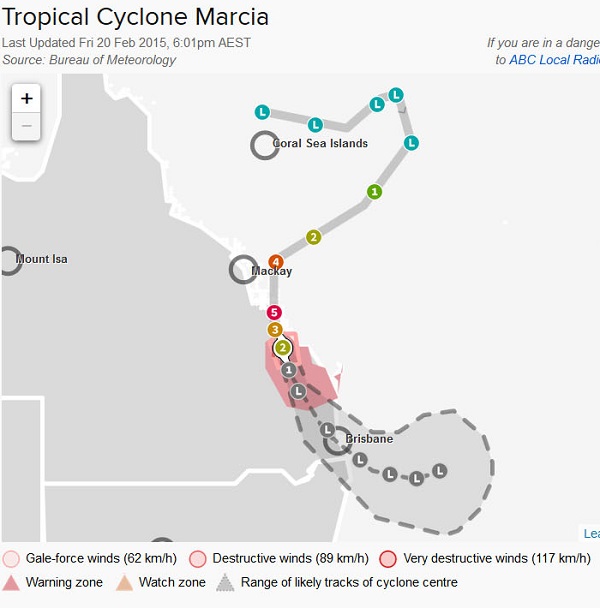
Mercifully Cyclone Marcia made landfall at Shoalwater Bay, a military training area between Yeppoon and Sarina, south of Mackay. The ABC coverage shows how it zigged and zagged after getting up steam in the Coral Sea:
It headed for Mackay and then side-stepped. Perhaps Kolobok Norris was out there on the beach waving his fists! I do hope he and Graham Bell were safe.
It gathered strength to become a category 5, but not nearly as big bad or ugly as Yasi. Nor will it penetrate as far into the inland, where large tracts remain parched.
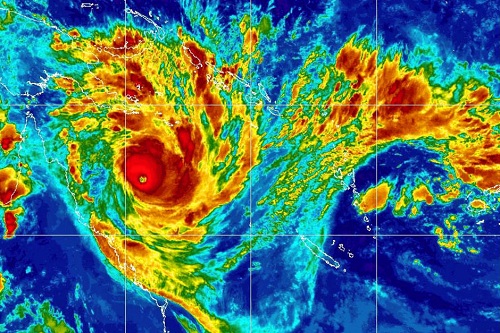
Here’s an image of Yasi:
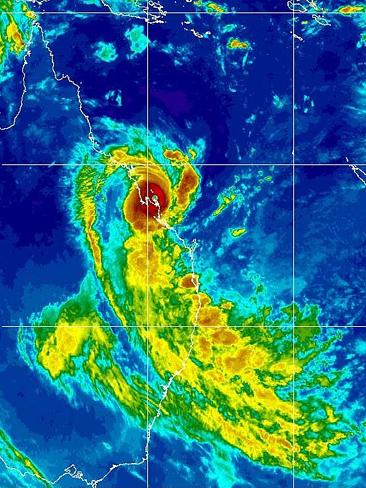
Here’s the equivalent of Marcia:
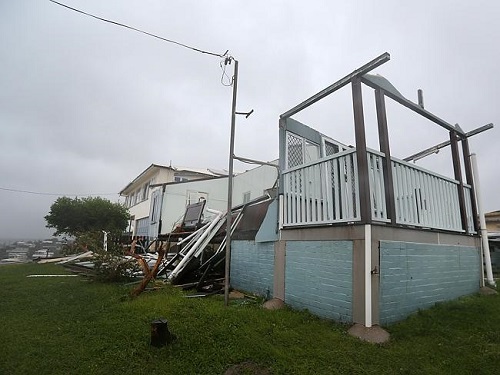
Cat 5 cyclones can destroy buildings. The Courier Mail has a photo gallery, including this:
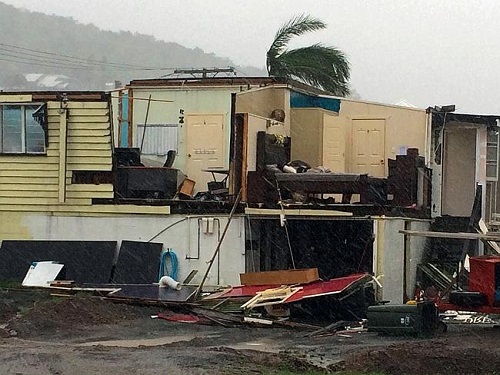
Here’s another:
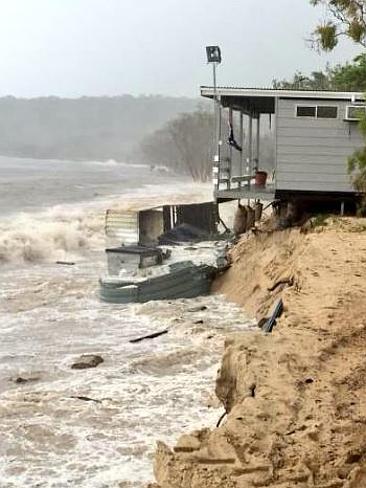
There was a three metre tidal surge and with significant erosion a tourist cabin fell into the sea on Great Keppel Island:
There will be a lot of personal stories of danger, escape and loss:

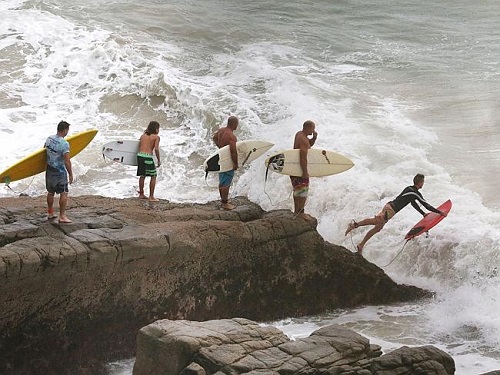
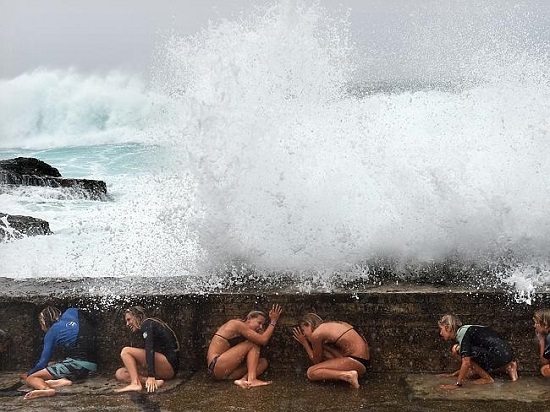
Some people, especially surf board riders, seem to be energised by these events. Here at Noosa they line up for their turn:
Here in South-east Queensland we’ve had a substantial rain depression for a couple of days. I gather it is related to Marcia but there is clear air between them as seen from this BOM screenshot late on Friday:
Considerable swells have already battered then Gold Coast:
Here in Brisbane we await the remnants of Marcia. I gather we are in a 12 hour interval which is like being in the eye of the storm. So far at our place we’ve had about 150 mm or six inches in the old money. We are assured that the main issues will be creek flooding and wind, with the possibility of trees bringing down power lines, hence blackouts and/or blocked roads. We are assured that it will be nothing like the floods of 2011. In fact we may get our reservoirs recharged which currently sit at a bit over 80%.
In the NT Cyclone Lam crossed the coast about 440 km east of Darwin, hitting some remote communities.
At time of posting (2 am) it looks as though Marcia has significantly fizzled and is mainly sliding through to the west of us. We’ve certainly had enough rain and it might do some good in agricultural areas.
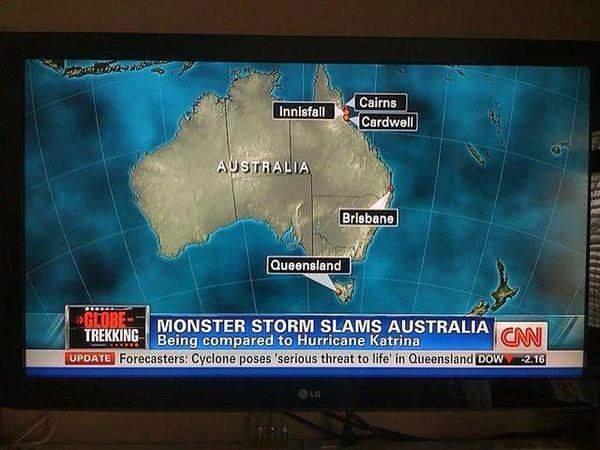
Update: Geoff Henderson has sent me a link to a CNN map shown on Facebook, with Tasmania labelled Queensland. Here it is:
Brian,
Haha, very good !
But yeah, nah, I was having a beer on the back patio watching MTSAT,among others .
At the time of my posting, she didn’t turn left ( to the South ) but rather a 270 degree right hand turn ( like on a roundabout to the South ).
We haven’t had a drop of rain since and been still as a grave since lunch time yesterday.
My youngest flew back up from Brisbane last night, now that was putting the wind up the Mrs !
Will be interesting to read the Building Inspectors reports that the insurers will do.
I suspect many findings of preexisting termite damage and dodgy renovations contributed to the roof losses, but don’t expect to see any mention in the media.
These systems are quite tight. You can be just outside the active zone and you might as well be 1000 km away.
Marcia seems to be on track and we are now very much in the middle. No wind, though, and the rain apparently half what was expected. Still, it’s pouring!
They are talking about a low forming off the NSW coast, bringing winds down there, but not cyclonic.
Great collection of Australians facing imminent danger there, Brian.
Any one know how I can get shares in the Company that produces Desalination Plant Mothballs ?
That is likely to be a boom and bust proposition, KN, a bit like being an LNP party member.
KN, the rain that’s falling at the moment seems mostly to be to the east of the Wivenhoe dam wall. It will be interesting to see whether the dams actually fill. They may have from the first burst.
Abbott in Livingstone, feeling the pressure of criticism of his performance as Minister for women, had a “woman” in the image frame for the entire interview. Her one opportunity to speak was a brief moment to say how wonderful she thought it was that Abbott visited the Northern Territory, now for the 4th time. He still does not “get” it.
“Fact” check required. Abbott has just claimed that the removal of the Carbon Price has put $550 a year in the pockets of families. I don’t think so at all.
BilB
Unless her name was Marcia, I think ya got the rong fred. 🙂
Exactly the case for NSW, Brian. Throughout the drought there was plenty of rain here, our swimming pool regularly overflowed and rarely needed topping up, and we are just 30 klms from the Megalong Valley catchment area for Warragamba Dam, but the rain failed for years to fall in the catchment area. Consequently when the dam levels fell to just several years reserves the desalination plant was contracted.
I think the NSW one is Mothballed too. ($500,000 per day )
And Victoria and Adelaide I recall.
Yep, mothball trading is the go.
Remembering jo nova’s “cyclone season? what cyclone season” thread, I am merging 2 at once cyclones into one national event. Apart from that any opportunity to share with people what a dunce we have for a prime minister is worthy of pursuing. In fact Abbott is the best case there has been for some time for Australia becoming a republic and having a President. He has degraded the prestige of the Prime Minister as head of state to such a degree that we may need a higher position in order to have a future leadership role that people can respect.
Mothballing desal plants? I think that water from the Megalong Valley catchment area should be pumped inland to the other side of the divide to support inland communities and the wind powered desalinated water used to top up the Sydney supply. Let’s try thinking a little bit more laterally.
As for mothballing Qld desal plants, KN, you have to admit that you live in a fractious state where at any time the fracking contaminated water of the Artesian Basin will reach community bores and there could be an urgent need for alternative water supplies. Therein is another reason to set up a water bucket system to move drinkable water inland. We were the lucky country.
KN: Woulda thought someone from the bush would understand that we can have long droughts as well as runs of relatively good rains.
One of the problems with city scale water shortages is that it takes time to build desal plants of the sort of capacity needed so building them is always a gamble that the desal plant won’t be needed for a long time after it is up and running. Ditto water recycling.
Dams John, they never get mothballed.
We built the Desal on the back of Flannerys ” Dams will never fill again ” and SE QLD now has 93%.
The problem isn’t less rain but more users.
It’s a storage issue rather than a production issue.
That’s my take anyway.
http://www.businessinsider.com.au/folsom-dam-illustrates-california-drought-2014-2
KN, I don’t think Flannery had anything to do with it. The catchment needs about 50mm of rain before anything runs off. We had high usage habits and there was no runoff for years on end. (About 4 from memory.)
The dams were down to about 15%, we were using about 1% a month and when they reach 5% they are affectively dry. So the desal plant was built in a panic. Corners were cut and I understand the damn thing has never worked properly.
Luckily it rained, but the average per capita use is still about half what it used to be. During the dry we learnt new habits and a lot of water saving devices were installed. And a lot of tanks.
So we seem to be OK for now.
I’ve added an update at the end of the post, showing the Facebook CNN map with Tasmania labelled as Queensland.
Geoff, I’ve deleted the email as requested.
The community of Byfield just south of Shoallwater Bay copped a real hammering. A beautiful area with a great community feel which I enjoyed visiting last May. Just devastating to see what has happened there.
Brian
I just don’t see any real downward trend in SE Australia.
The Beattie/Flannery panic was a bit like the early 40s.
If anything, according to the EPA, global warming is getting the world more rain.
A certain percentage of this increase must be falling on land.
Dams rather than desals, to my mind, make more sense.
Dams are useful in both good and bad times.
( zoot, I’m not going to play the ” weather event game ” it’s about trends )
KN@15: You might have missed it but dams don’t work if the rain don’t fall. So dams aren’t much use in really bad times.
Desal plants operating on sea water do work when the rain don’t fall.
My recollection is that the LNP whinged when the big drought was on and water infrastructure hadn’t kept up with demand.
Then the rain came and the LNP has been whingeing ever since about money wasted on water infrastructure. It is a long time since the LNP had any long term vision.
KN, since the grid was installed we can move water around SEQ to some extent, notably to the Gold Coast and Toowoomba.
Thanks for the links. My understanding is that yes, there will be more precipitation overall, but more big falls, more droughts and the rain won’t necessarily fall where it used to. Also drying will be greater and run-off less in significant areas like the Murray-Darling Basin.
There is a prospect of more mega-droughts in SW USA. In the SW of WA there has been a step down since around 1970. I’ll post stuff as it comes to hand.
Doug @ 19, yes Byfield apparently was in the front line. Overall I heard that the damage was more extensive than at first thought – over 700 buildings, as against 500 initially, from memory.
KN, check out the State of the Climate 2014.
Some excerpts:
kN @20: I was not playing any game, I merely posted a link to images showing a ‘mothballed’ dam. I’m sure it will be taken out of mothballs when it rains again.
Dams are no solution where there is declining precipitation (like where I am).
KN@20: Interesting set of graphs but they all covered large areas. For this reason they don’t show the 11 yr rain shortage that led to the Wivenhoe dam crisis. The dry patch around Brisbane was offset by rain in the north of Qld.
Have a look a this article on latitudinal atmosphereic circulation patterns. Talking about Qld the tropical Hadley cell causes a lot of rain in the tropics where moist air rises and very dry areas where dry air flows downwards. Movement of these cell boundaries can vary the weather in parts of the state without having alot of effect on the state totals.
John,
I was trying to avoid taking a narrow focus on specific places and a small time frame.
But if you can find a graph of rainfall in the Wivenhoe catchment for the last 150 years or so, or even a specific farm or official rain gauge readings going back at least 100 years in the area, I’ll gladly look at it to try to determine if co2 increases are increasing or decreasing ( or indeed not changing ) rainfall on that little spot.
KN: Have a look at some of the Wivenhoe rain data here. I haven’t read the full report.
Keep in mind that the graphs you are looking at in fig 1 are 10 yr rolling averages. Means that a very dry year won’t be all that obvious.
This comment highlights just how variable the flow into Wivenhoe is and the importance of major rain events:
KN, within climate science there is a field of ‘attribution’. I think you should leave it to the experts.
Last I heard they were not prepared to say that precipitation patterns in this part of the world had changed due to human agency.
Brian: If you look at the link @28 you can see how easy it is to see trends that disappear when you look over a longer period of time. For example, Wivenhoe results from 1995 to present suggest a downward trend while results from 1900 to present show no clear pattern.
Fig 2 is interesting. Look at just how much higher the flow for 1894 is compared to the 1974 floods. If we get another one of these.
Brian @ 29.
” Expert ” Tim Flannery said exactly that.
kN @15:
Unfortunately leaves out Flannery’s qualifier, helpfully highlighted by kN @31:
Ok zoot, whatever you say.
*sigh*
For nobody in particular,
https://www.youtube.com/watch?v=cJCczZd7HVk#t=131
There is a clear message there, KN, trust the conclusions of scientists whose job it is to study climate and weather dispassionately and thoroughly.
John @ 30:
We could be OK if the Wivenhoe Dam manual prioritises getting water down the river over keeping low-lying crossings open.
From my post in 2012:
2011 was almost as big as 1893. As you will recall, we would have been OK in 2011 if the engineers had started letting extra water out as soon as it reached “full”.
KN @ 31, I don’t rate Flannery as a climate scientist. He came in at the top from being the director of a museum. I’m not aware of any actual climate science he’s done.
Nevertheless, nor have I and the comment you quote seems perfectly in order to me.
Frankly I’m puzzled as to why the drying evident in the maps in the State of the Climate 2014 report I linked to @ 24 are not evident in the graph you linked to @ 20. I’ll keep an eye out and the answer might come.