
Back in 2001 the IPCC devised the famous Burning embers graph to reflect a broad perspective of risks emanating from climate change. Seventeen scientists have now had another look, original paper here. The graph has been enhanced with more information, which is itself more up to date.
Here is the version from IPCC Fifth Assessment Report (AR5), which dates from 2014:
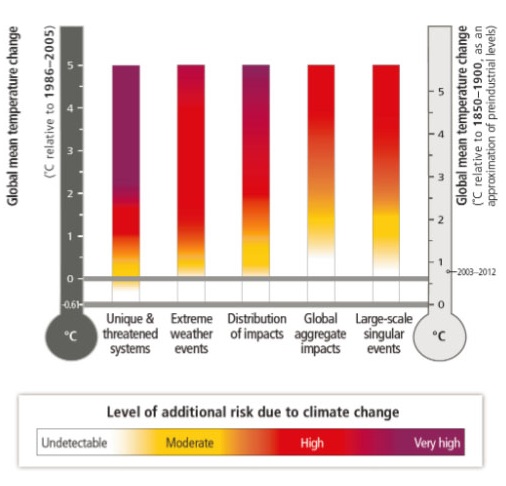
The first thing to note is that the left-hand side temperature is basically distracting. Referencing temperature to the average for 1986-2005 has little point. On the right-hand side 1850-1900 is meant to stand for ‘pre-industrial’. Hansen recently used 1880-1920, which I imagine is similar.
Each bar represents a ‘reason for concern’. These are labelled RFC in the new graph, and are explicated in the link:
- RFC1 Risks to unique and threatened systems (endangered animals and ecosystems)
- RFC2 Risks associated with extreme weather events (floods, heat waves, storms, hurricanes)
- RFC3 Risks associated with the distribution of impacts (this reflects the fact that some groups will be hit harder than others, depending on where they live or their socioeconomic status)
- RFC4 Risks associated with global aggregate impacts (anything that can be measured globally, such as lives lost, monetary damage, species at risk)
- RFC5 Risks associated with large-scale singular events (there are all those tipping points we keep talking about. For example, if the West Antarctic ice sheet does collapse, or if the North Pole melts for good).
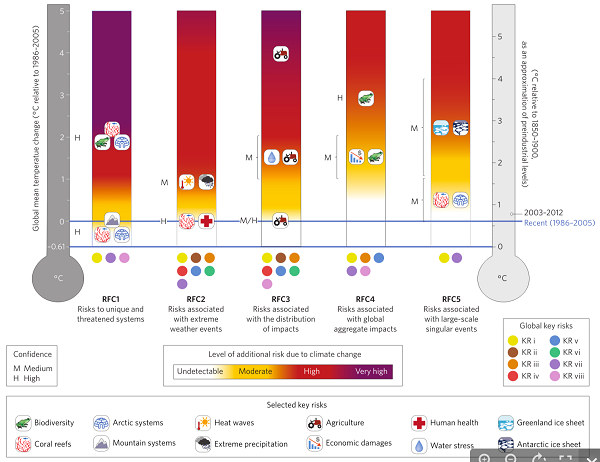
Now for the new graph:
Here’s Hansen’s recent graph:
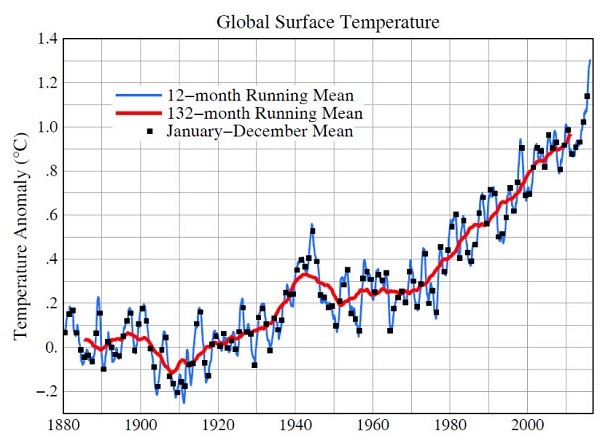
Hansen has the 132-month (11-year) running mean at just under 1°C, similar to the new graph. However, the temperature has surged in the last three years, with 2016 likely to end a little below the current 1.3°C. It’s awfully close to 1.5°C.
M and H near the bars reflect medium or high levels of confidence. For what the coloured dots mean you may have to go to Table 1 of the paper. They represent key risks identified in IPCC AR5.
If copied them here, and you may be able to read them with a ‘zoom out’ facility, which is at the top right of my browswer:
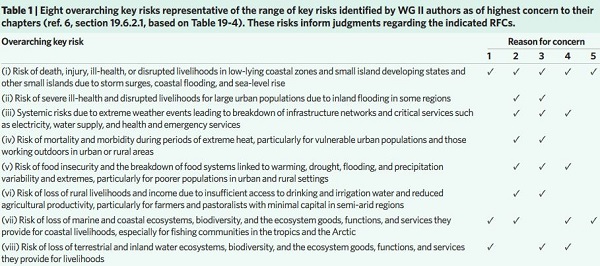
Clearly, though, coral reefs, mountain systems, Arctic systems, health and agriculture are being impacted. Conceptually extreme weather seems to be treated as a medium through which climate change works.
Sea level rise is seen as becoming critical with the Antarctic and Greenland ice sheets seriously in play as we approach 3°C. I don’t think they are saying that the ice sheets will be lost entirely at that temperature, as is suggested in the linked article. The paper discusses SLR in terms of the length of time it takes, and what might happen if we reduce emissions. They do appear to consider, however, that beyond one metre of SLR adaptation becomes extremely difficult.
In Scoping long-term sea level rise I suggested that 3°C might give us 25m (±5) eventually. However, that was on atmospheric CO2 levels roughly the same as what we’ve got now, if you ignore methane and the other greenhouse gases.
A recent study found that:
- Around 9.6 million people in Bangladesh, excluding temporary and seasonal migrants, will migrate internally due to climatic factors between 2011 and 2050.
They also found that 6 million had to move out of their houses because of SLR.
The people in Tampa Bay, Florida are coping with a report from the Tampa Planning Commission:
- The planning commission’s report considers risks which may plague the Tampa Bay region as early as 2040, which includes a threat to homes, businesses, and Tampa General Hospital. That’s serious business.
It’s happening!
By the way, I am aware that as I write parts of the Northern Hemisphere are very cold indeed. It will be interesting as to how the global average temperature works out. Typically when the cold air moves south the Arctic warms by about 20°C. Arctic sea ice extent is flatlining when it should be growing:
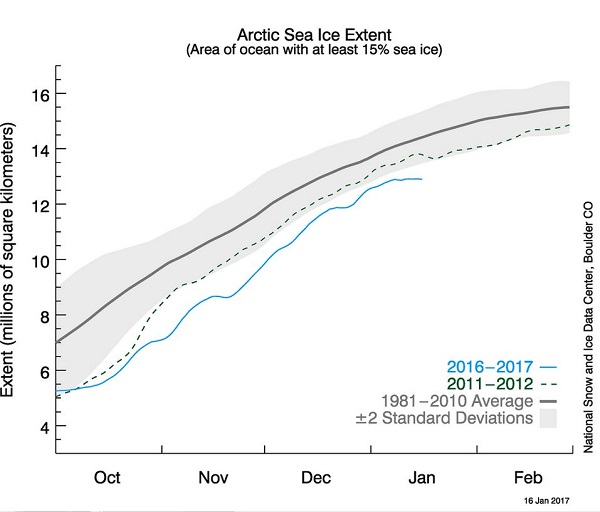
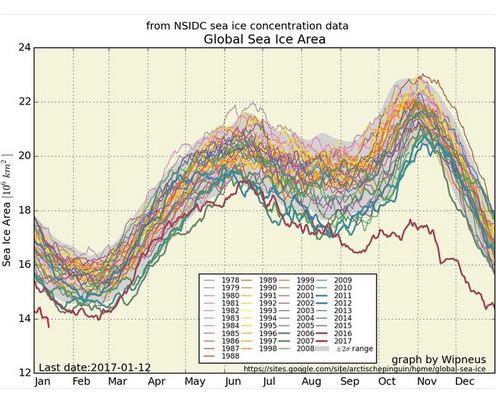
I understand it was the second lowest on record for December. Global sea ice, including Antarctica, is charting new records in a dramatic fashion:
There is an enormous block of ice about 500 km wide that is connected to Antarctica by a small neck of ice. Given the rate ice is melting there this year could it break away? (See S 75 deg, W170 deg .)
It is quite possibly still grounded, John, but nothing is surer than it will become free in the near future, if you are talking about the Walgreen Coast one which seems as though it might be pivoting around something.
There was a snippet in the New Scientist saying that in December a crack in the Larsen C ice shelf opened by a further 20 km in just two weeks. There is now (then) only 18 km holding it.