
At Carbon Brief the most read post is The what, when and where of global greenhouse gas emissions: A visual summary of the IPCC’s climate mitigation report from 13 April 2014. It is an excellent post, condensing the message of a complex report. What a pity that it is completely out of date and more than a little misleading in terms of current scientific realities!
The problem is that because of the publishing cycle and the compilation process in putting together the IPCC reports the science they are based on is about three years old at time of first appearance. Then the IPCC reports are quoted in the media as gospel for a further seven years.
As I explained back in June in The game is up following a David Spratt post from May, there is no burnable carbon left if we want a reasonable chance of a safe climate. I repeat here three quotes from Spratt:
We have to come to terms with two key facts: practically speaking, there is no longer a “carbon budget” for burning fossil fuels while still achieving a two-degree Celsius (2°C) future; and the 2°C cap is now known to be dangerously too high.(My bold)
He says we need to take a proper approach “around contingency planning for high-impact and what were regarded as low-probability events, which unfortunately are now becoming more probable”.
If a risk-averse (pro-safety) approach is applied – say, of less than 10% probability of exceeding the 2°C target – to carbon budgeting, there is simply no budget available, because it has already been used up.
We all wish the incremental-adjustment 2°C strategy had worked, but it hasn’t. It has now expired as a practical plan.
There is no longer a non-radical option, only one path remains viable: the emergency ‘war economy’ mode.
Even when it was written the IPCC report was problematic. Take for example this statement in the Carbon Brief summary:
It shows that if emissions between 2005 and 2030 are within the dark green chunk on the left panel, then reductions between 2030 and 2050 would need to be around three or four per cent a year (the dark green bar on the middle panel). If emissions follow a path within the lighter green chunks on the left, reductions will have to be closer to five or six per cent a year between 2030 and 2050 (the lighter green bars in the middle panel).
In October last year I posted this graph from Malte Meinshausen which dates from 2009:

In other words if we leave peaking until 2030 we will need annual reductions of emissions of 22.6%, reach zero by 2043 and then go negative. That was before the “carbon budget” shrunk.
In my view the world should aim peak by about 2020, try to reach zero by 2030 and then go negative. In Oz as the largest per capita emitter of the major economies we should be aiming for 45 to 50% reductions by 2020.
The portrayal of the problem as it stands in the Carbon Brief post is in my view dangerously irresponsible. In my own summary of the mitigation report in May I called the approach taken “reckless”.
Nevertheless it has a useful graphic which gives an overview of where the emissions are coming from:
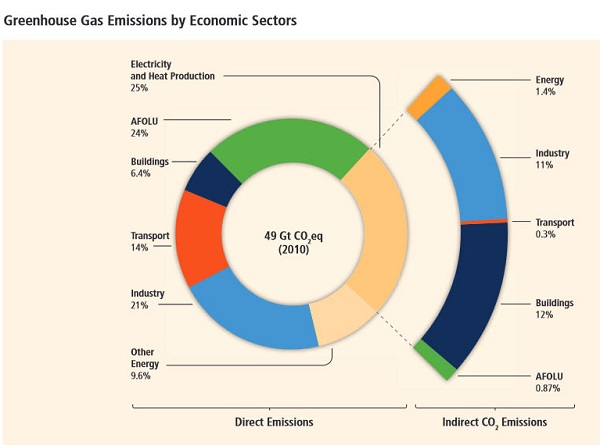
Our focus tends to be on electricity and motor vehicle transport, which amount to less than half of the problem. The green AFOLU segment represents agriculture, forestry and land use, a segment that is particularly difficult to deal with.
There is much to be done!