Tag Archives: Temperature

February 2016 the hottest (satellite) month

There’s been a story around that February was the hottest single month ever, and I think the ABC segment quoting Professor David Karoly may have added to the confusion. They spoke of:

    preliminary analysis of surface air temperature and comprehensive analysis of satellite-based temperature observations, showing February 2016 had set a new record for the hottest ever February and the hottest ever month in long-term observation. (Emphasis added)

Continue reading February 2016 the hottest (satellite) month

Climate clippings 162

1. China putting the brakes on coal

China exponentially increased its use of coal in the early part of this century, so that 64% of its energy comes from coal. Now studies suggest that coal use in China declined in 2014 and may have peaked in 2013. No new mines will be approved in the next three years. Continue reading Climate clippings 162

Australia’s annual climate statement 2015

Subjectively 2015 seemed like a very hot year, so there may be some surprise to find that according to the BOM’s Annual climate statement 2015 it was only the fifth hottest year. That’s possibly because the October-December period was the hottest on record. There was exceptional heat early in October, with parts of Victoria being 7°C above normal. Nationally October was 2.89°C above the 1961-90 average, a record monthly anomaly. Continue reading Australia’s annual climate statement 2015

Climate clippings 161

1. Lakes warming faster than atmosphere

Courtesy of John D, from Gizmag, an item that has implications for algal blooms, health of species, food and methane emissions.

    Specifically, the results show that the average temperature in the lakes has been rising by 0.61 degrees Fahrenheit every 10 years. While that might not seem too significant, it’s a higher rate of warming than witnessed in either the atmosphere or the ocean, and the long-term effects could be pronounced… Continue reading Climate clippings 161

Climate clippings 153

1. July hottest ever

Not just the hottest July, we’ve just had the hottest single month since records began in 1880. It’s also been the hottest first seven months of any year, so we are heading into new territory. Continue reading Climate clippings 153

Climate clippings 148

1. Hansen’s alarming new sea level rise scenario

James Hansen has a 17 author paper out suggesting that we could have multi-metre sea level rise this century. It’s based on the notion that meltwater from the ice sheets interrupts ocean circulation patterns, which then cause a feedback loop via larger storms. I think that’s it in brief. Continue reading Climate clippings 148

Climate clippings 143

1. Greater trust engendered in UN climate meetings

A week of UN climate meetings in preparation for the Paris Conference of Parties in December has just taken place in Bonn. The main outcome was trust, in the Conference co-chairs of the various subgroups established and in the procedures adopted. Continue reading Climate clippings 143

Climate clippings 135

1. Closing down dirty power


From Climate Code Red
, a recent Oxford University report:

identified the most-polluting, least-efficient and oldest “sub-critical” coal-fired power stations. It found 89% of Australia’s coal power station fleet is sub-critical, “by far” the most carbon-intensive sub-critical fleet in world.

The International Energy Association, within a framework that itself is probably inadequate, says that one in four sub-critical power stations should close within five years. Hence 22% of our power stations should close within five years if we are to do our part. Continue reading Climate clippings 135

Global temperatures may be about to jump

Joe Romm at Climate Progress comments on recent research that suggests a significant increase in global temperatures may be imminent.

‘Significant’ here means two- or three-tenths-of-a-degree Celsius, which compares to the 0.16°C/decade average seen in this graph from NASA:

NASAwarmingTrend-cropped_600

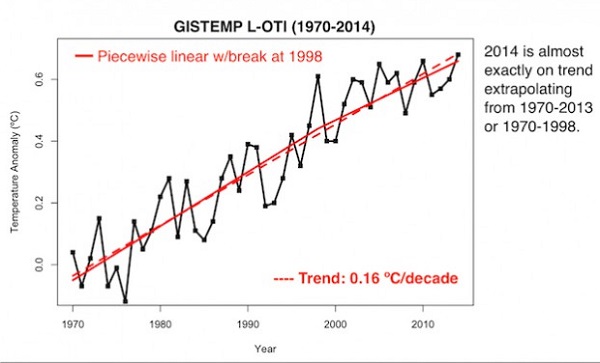
Clearly in this graph there was a jump in the temperature around 1998, then a period of consolidation of near record temperatures or small increases in the temperature. All the years from 2001 on were hotter than 1997.

Kevin Trenberth explains that most of the additional warmth (over 90%) goes into the ocean and global increases tend to happen towards the end of an El Niño event, while La Niñas tend to be cooler. This pattern of El Niños and La Niñas (ENSO) which last 6 to 18 months is superimposed on the pattern of PDOs (Pacific Decadal Oscillations) which can last a decade or more. The importance of the PDO was outlined in the post Explaining the pause that wasn’t last December.

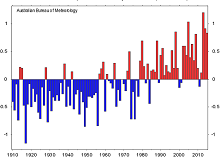
The pattern of PDOs is shown in this graph:

Pacific-Decadal-Oscillation-3-15_600

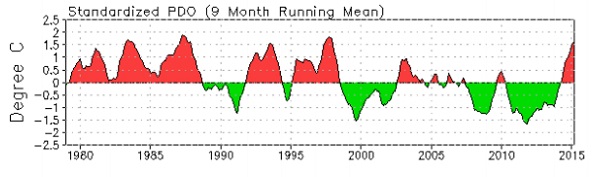
The 1998 jump came with the super El Niño in 1998 at the end of an extended period of positive PDO, from 1992 and 1998. Now we are entering an El Niño at a time when the PDO has turned strongly positive.

Romm interviewed Kevin Trenberth:

I interviewed Trenberth this week, and he told me that he thinks “a jump is imminent.” When I asked whether he considers that “likely,” he answered, “I am going to say yes. Somewhat cautiously because this is sticking my neck out.”

What is not said here is that the current El Niño is a weak one and may not have much effect on the weather. Trenberth thinks the PDO has the greater effect, which is then modulated by ENSO. Given the shape of the PDO over the last 15 years, the current El Niño might be like pulling the cork on a bottle of fizz.