Tag Archives: El Niño

Climate clippings 201

1. Australian fund managers short Tesla and Elon Musk

When Elon Musk dramatically promised to build a grid-scale battery in South Australia, the media was enthralled. Share traders and a string of Australian fund managers smirked. They’d seen it all before, and were shorting him in the market.

In that very week he was in the market with plans to raise $US1.15 billion in equity and convertible notes. I understand also that Tesla has gone strangely quiet about SA since then. Continue reading Climate clippings 201

Climate clippings 198

1. LiquidPiston engine

The innovative LiquidPiston engine, mentioned by BilB, is targetting a global market worth $460 billion. It has a power to weight ratio more than ten times better than a regular engine:

The big bruiser on the left puts out 35 HP, the one on the right 40 HP. Continue reading Climate clippings 198

Climate clippings 161

1. Lakes warming faster than atmosphere

Courtesy of John D, from Gizmag, an item that has implications for algal blooms, health of species, food and methane emissions.

    Specifically, the results show that the average temperature in the lakes has been rising by 0.61 degrees Fahrenheit every 10 years. While that might not seem too significant, it’s a higher rate of warming than witnessed in either the atmosphere or the ocean, and the long-term effects could be pronounced… Continue reading Climate clippings 161

Climate clippings 159

1. Greg Hunt the worst environment minister ever

I’ve just discovered this one from August, where Ben Eltham unloads on Greg Hunt, calling him our first minister for pollution:

    There are no kind words that can be said about Greg Hunt. When it comes to protecting the environment he is useless, and actually seems to revel in eviscerating the portfolio he is responsible for. Continue reading Climate clippings 159

Global temperatures may be about to jump

Joe Romm at Climate Progress comments on recent research that suggests a significant increase in global temperatures may be imminent.

‘Significant’ here means two- or three-tenths-of-a-degree Celsius, which compares to the 0.16°C/decade average seen in this graph from NASA:

NASAwarmingTrend-cropped_600

Clearly in this graph there was a jump in the temperature around 1998, then a period of consolidation of near record temperatures or small increases in the temperature. All the years from 2001 on were hotter than 1997.

Kevin Trenberth explains that most of the additional warmth (over 90%) goes into the ocean and global increases tend to happen towards the end of an El Niño event, while La Niñas tend to be cooler. This pattern of El Niños and La Niñas (ENSO) which last 6 to 18 months is superimposed on the pattern of PDOs (Pacific Decadal Oscillations) which can last a decade or more. The importance of the PDO was outlined in the post Explaining the pause that wasn’t last December.

The pattern of PDOs is shown in this graph:

Pacific-Decadal-Oscillation-3-15_600

The 1998 jump came with the super El Niño in 1998 at the end of an extended period of positive PDO, from 1992 and 1998. Now we are entering an El Niño at a time when the PDO has turned strongly positive.

Romm interviewed Kevin Trenberth:

I interviewed Trenberth this week, and he told me that he thinks “a jump is imminent.” When I asked whether he considers that “likely,” he answered, “I am going to say yes. Somewhat cautiously because this is sticking my neck out.”

What is not said here is that the current El Niño is a weak one and may not have much effect on the weather. Trenberth thinks the PDO has the greater effect, which is then modulated by ENSO. Given the shape of the PDO over the last 15 years, the current El Niño might be like pulling the cork on a bottle of fizz.

Climate clippings 129

1. Polar bears – uncertain future

The Mail on Sunday recently declared the polar bear in good shape on the basis of the opinion of biologist Dr Susan Crockford, who says:

“On almost every measure, things are looking good for polar bears … It really is time for the doom and gloom about polar bears to stop.”

It turns out that Crockford’s expertise is the archaeology of dead dogs and the identification of animal remains, and receives funding from the Heartland Institute to spread disinformation about human agency in climate change.

Information, reliable or not, is difficult to come by. This is a snapshot of one estimate of how the polar bear is travelling:

Polar bears_screenshot-2015-03-04-154610_575x539

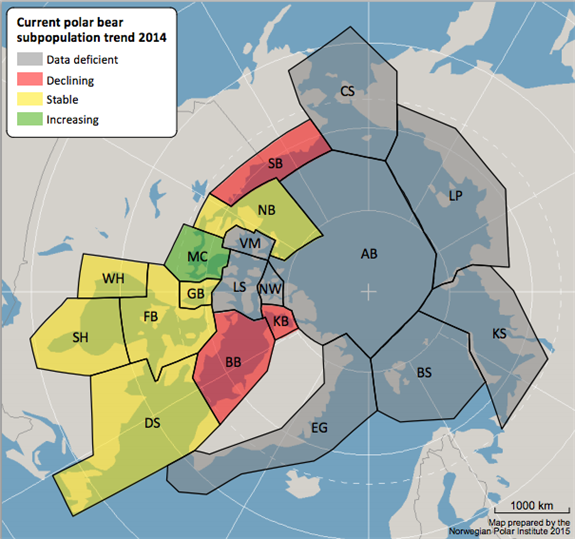
In nine of the 19 populations of polar bears information is deficient.

On their future the best estimate is:

To keep polar numbers relatively healthy, though still lower than today, scientists suggest global temperatures should not exceed 1.25 degrees Celsius above the 1980-1999 average.

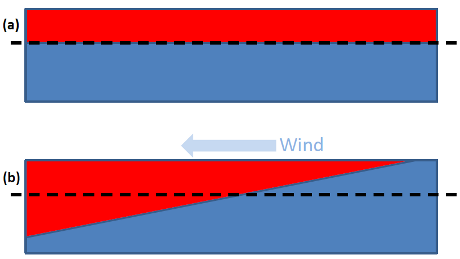
2. Arctic sea ice is getting thinner faster than expected

Measuring the thickness of the Arctic sea ice sheet is not a simple matter. data from disparate sources has been brought together for the first time.

in the central part of the Arctic Ocean basin, sea ice has thinned by 65% since 1975. During September, when the ice reaches its annual minimum, ice thickness is down by a stunning 85%.

3. UK auctions for renewables

Contracts worth £315 million have been awarded to 27 renewable energy projects with a combined capacity of 2.1 gigawatts.

The majority of the 27 schemes are windfarms, including 15 onshore and two offshore schemes (the blue and green chunks below). The remaining contracts went to five solar farms (yellow) and five schemes that will burn or gasify waste to generate energy (black and grey).

UK_Screen Shot 2015-02-26 at 15.48.48_600

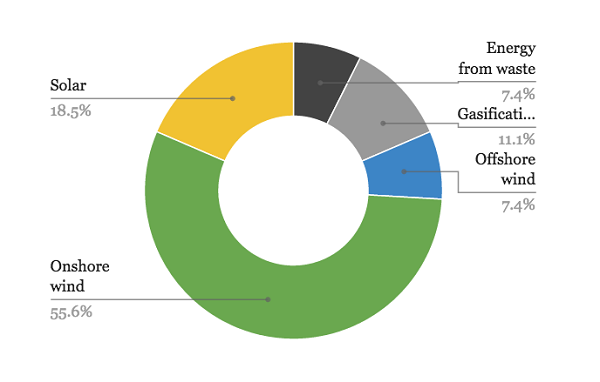
By peak capacity the outcome looks rather different:

UK_Screen Shot 2015-02-26 at 15.48.54_600

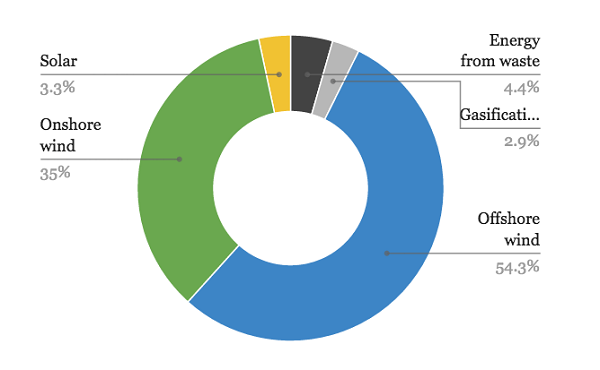
The auction was divided into two pots, with one pot reserved for “less established” technologies.

The big surprise was the prices, which were lower than expected.

4. Keystone XL pipeline bill vetoed

It’s important to note that the pipeline bill has been vetoed, not the pipeline.

Keystone is not dead. The bill was a political Tea party move to pre-empt State Department approval, which will now continue until a recommendation in made to John Kerry as Secretary of State.

Meanwhile Nebraska landowners are fighting a case in the courts. They claim state law giving TransCanada the right to drive the pipeline through their land under ’eminent domain’ is unconstitutional.

If the landowners succeed TransCanada does not have a route for the pipeline.

A longer post on the issue is here.

5. The IPCC reviews it’s processes

Every seven years the IPCC publishes three whopping reports followed by a Synthesis Report. Working Group 1 looks at the physical basis of climate change. Working Group 2 looks at impacts, adaptation and vulnerability. Working Group 3 looks at mitigation. Each of these whopping tomes has a Summary for Policy Makers of about 30 pages.

The main decision is that the program will continue with some minor modifications. They will try to link the second and third volumes more specifically to the first, while producing the whole series within about 18 months.

More special reports on specific issued will be produced during the interim years.

They will try to make the summaries for policy makers more readable.

6. NZ infestation of flat-earthers climate denialists

The Dominion Post is the newspaper of record for New Zealand’s capital city, Wellington. Last Friday it featured an opinion piece by high profile climate denialists Bob Carter and Bryan Leyland titled Hypothetical global warming: scepticism needed. Gareth Renownden at Hot topic calls it

a “Gish Gallop” of untruths, half-truths and misrepresentations — a piece so riddled with deliberate errors and gross misrepresentations that it beggars belief that any quality newspaper would give it space.

He then identifies 24 specific errors or misrepresentations.

7. EU adopts climate change targets for Paris conference

The EU formally adopted on Friday climate change targets for December’s Paris conference including a 40 percent cut in emissions by 2030, climate commissioner Miguel Arias Canete said.

The targets were agreed on by leaders of the 28 European Union member states at a summit in October, but the confirmed benchmarks have now been officially sent to the UN, Canete said.

The EU was the second after Switzerland to publish its submission.

In other EU news, the Commission is to spend €100 million on projects aimed at connecting energy networks across the continent.

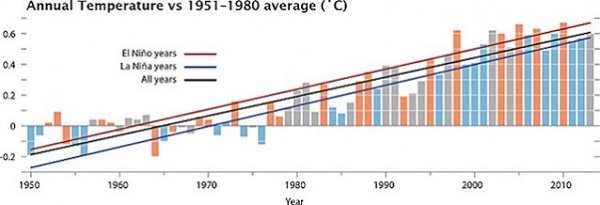
8. El Niño finally arrives

El Niño has finally arrived at a time of the year when they usually decay. It’s weaker than usual and is unlikely to have much impact on world weather.

9. US weather conundrum

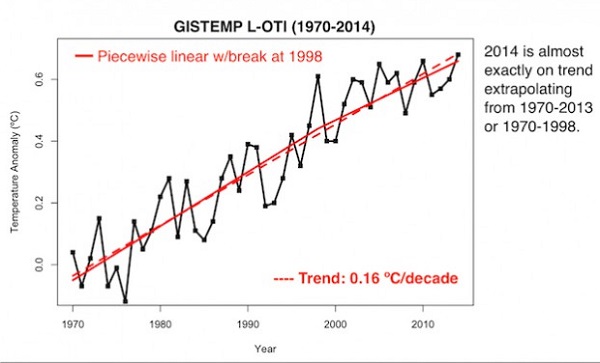
Last week I reported (Item 1) that the planet had just experienced the hottest 12 months, while it was freezing in eastern North America during January and February and into March.

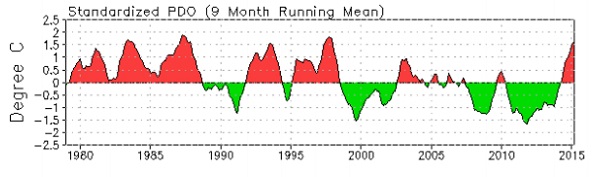
Because winter includes December and December was mild, no state had a record low winter. In fact the East’s brutal cold was offset by record warmth in the West, which was caused by warmth in the Northern Pacific. The experts think this pushed the jet stream out of shape, bringing Arctic air further south in the east.

It seems the Northern Pacific warmth has now moved to the Central Pacific, causing the weak El Niño referred to above.

Reminder Climate clippings is an open thread and can be used for exchanging news and views on climate.

Explaining the pause that wasn’t

4732500-3x2-220

We’ve only just seen that statistically there never was a recent ‘pause’ or ‘hiatus’ in warming when two articles show up explaining the pause that wasn’t. A key word here is statistically. No-one is suggesting that there may not be variations from time to time that do not breach the trend.

Also climatologists are always interested in understanding the physical mechanisms behind both short-term variability and longer term trends.

First, via Carbon Brief there has been a new study examining the impact of aerosols from volcanoes.

Virtually all research into the climate influence of volcanic aerosols has used satellite measurements of particulates in the upper atmosphere (the stratosphere). These satellite measurements only monitor the volcanic aerosol at heights of 15 km and above. The new paper by David Ridley and colleagues studied the amount of volcanic aerosols in portions of the stratosphere that lie below 15 km.

They found that 30 to 70% of aerosols from recent eruptions lodged below the 15 km mark. Further, these lower level aerosols had been responsible for significant cooling since 2000. Taken together with additional heat being stored in the deep oceans, the slowdown is “both fully accounted for and temporary.”

Estimated volcanic cooling from this source is not included in climate models.

A second study looks at the influence of Pacific winds on warming since the 1890s. They did this by analysing the chemical make-up of corals.

The coral record suggests, for example, that trade winds were weak between 1910 and 1940 when the Earth warmed by 0.4 degrees, and were strong from 1940 to 1970, during a period of relatively little increase in global temperatures.

Apparently the winds have been very strong since the turn of the century.

The winds in question are the trade winds that move tropical surface water from east to west. This two-dimensional image attempts to illustrate the complex pattern. Trade winds just north and south of the equator drive warm surface water westwards:

edu13-image_550x447

The water is replaced by cool water rising from the deep, which is known to affect global average surface temperatures. A simplified mechanism of how this works is given in the following:

thermocline

Knowledge of the influence of the wind on temperature variations is not new. For example, Matthew England of the University of NSW and others published a paper early in 2014 on the subject. England says of the new paper:

“This is a really important study: it confirms the crucial role of the Pacific Ocean in driving decadal climate variability at a global scale.”

The strength of the trade winds is associated with a natural climate phenomenon called the Interdecadal Pacific Oscillation (IPO). The IPO has positive and negative phases, which switch every few decades. Lead author Professor Diane Thompson says:

“We do know that the typical lifetime of a phase of this cycle is less than 30 years, and the current one began about 15 years ago. So although the timing of that switch remains difficult to anticipate, it would be most likely to happen within the next one to two decades.”

We don’t know the future of volcanic activity, nor when the Pacific wind pattern is going to switch. What we do know is that both have been inhibiting warming in recent years.

Of course Pacific wind patterns are also associated with ENSO where El Niño years are warmer and La Niña years are cooler. A year ago Stefan Rahmstorf looked at The global temperature jigsaw where he identified a variety of influences at work. It included a graph from a 2012 paper which used a multivariate correlation analysis to take out the influence of ENSO, volcanoes and solar activity. The pink line shows observed data and the red line with those three factors removed:

Rah2012_600

The ‘pause’ effectively goes away.

The observed data (pink line) in the above graph is an average of five data sets. It is likely that two of them, HadCRUT and NOAA omitted the Arctic entirely. I’ll post again the recent HadCRUT4 hybrid data from the satellite era which Rahmstorf suggests is now the best:

trend1_600

Again a pause is pretty hard to find, especially if you ignore 1998 as a outlier year. Of course 1998 should not be ignored as it appears to have had a crucial role in transferring stored heat from the ocean to the surface. It’s worth remembering just how little of the planet’s energy is stored on the surface compared to the ocean:

GW_Components_570

Rahmstorf did predict that when we had another El Niño year a new record would be set. 2014-15 is not an El Niño, not yet, but is being heralded as the warmest ever. I’ll wait for it to actually happen before reporting on it further. Meanwhile it’s a fair bet that we will have strong warming in the next few decades.

Climate clippings 105

1. Atlantic Ocean important for heat storage

Most of the energy from global warming goes into the ocean as this graphic from Skeptical Science illustrates:

GW_Components_570

The linked paper stresses the role of the Atlantic in heat uptake. The following graph shows the heat uptake for the four main oceans. The black line is the sea surface temperature, the red line shows the heat below 1500 metres.

oceanheatuptake_chentung-2014-_550x496.jpg

All this is considered in relation to the socalled warming ‘hiatus’. The suggestion is that the Atlantic Meridional Overturning Circulation is the critical influence and it changes phase every 20 to 35 years. If so the ‘hiatus’ could last another decade or so.

Other scientists see the hiatus as multi-causal. It also depends which temperature series you are looking at. The HadCRUT temperatures always look flatter in recent years, as in this article. The Gistemp series from NASA has 1998 as about the third highest and shows a continuing upward trend, albeit slowed..

2. ‘Unprecedented’ ice loss in Greenland and Antarctica

Since 2009 the volume of ice loss has tripled in West Antarctica and more than doubled in Greenland, the highest rate of ice loss since satellite records began 20 years ago.

While it’s still early days, sea level rise this century could surprise on the upside.

3. El Niño watch

Carbon Brief also have the latest on the chances of an El Niño developing in 2014, which the Australian BOM now put at about 50%. Earlier there was talk of a super El Niño, which is still possible.

4. China gets into emissions trading

The Chinese national market will start in 2016.

The Chinese market, when fully functional, would dwarf the European emissions trading system, which is now the world’s biggest.

It would be the main carbon trading hub in Asia and the Pacific, where Kazakhstan and New Zealand already operate similar markets. South Korea will start a national market on Jan. 1, 2015, while Indonesia, Thailand and Vietnam are drawing up plans for markets of their own.

Looks like quite a trend. Time perhaps for Australia to join in!

5. World’s poor need grid power, not just solar panels

Small scale solar power is quite popular in Africa and supported by environmentalists. A few panels are able to run a few lights, a radio, charge the mobile phone but stop short of boiling a kettle. Critics see this as condemning the poor to a constrained future. Only 20% of Kenyans are connected to the grid.

Coal fired power is obviously not the answer. Dams take years to build, are typically over budget, inundate fertile lands or forest areas and interrupt natural stream flow.

In the Democratic Republic of Congo the mega project of the Inga 3 dam is due to start construction on the Congo River. If fully developed it will produce twice as much electricity as the world’s largest, the three Gorges in China. But will it be economically justified and what impacts will it have on the environment?

6. Emissions from energy generation jump after carbon price axed

Carbon emissions from the country’s main electricity grid have risen since the end of the carbon tax by the largest amount in nearly eight years.

Data from the National Electricity Market, which covers about 80 per cent of Australia’s population, shows that emissions from the sector rose by about 1 million tonnes, or 0.8 per cent, at an annualised rate last month compared with June.

That is the biggest two-month increase since the end of 2006, and came as a result of an increase in overall demand and a rise in the share of coal-fired power in the market, according to Pitt & Sherry’s monthly Cedex emissions index.

From what I can make of it, gas is increasingly going to export, there is some scaling back of hydro, presumably because of the weather. and large scale solar was killed off ages ago. The slack is being taken up by old coal, including brown coal.

Abbott’s strategy of saving the coal fired power industry seems to be working.

Building new more efficient coal would be his ultimate aim. This would involve investors and lenders having confidence in the future of coal. Surely they can’t be that stupid!

Reminder: Use this thread as an open thread on climate change.

Climate clippings 96

Climate clippings_175 This edition looks at changes in the cryosphere, a major US report, the prospects for an El Niño and the problem of China burning coal.

1. Pacific Ocean hot spot

Scientists have discovered a hot spot in the Pacific Ocean which is partly responsible for global warming in the Arctic. Incredibly this hot spot is east of Papua New Guinea.

This phenomenon is attributed to natural variations rather than global warming. Therein, perhaps, lies the reason that scientists have been constantly surprised by the rapidity of the Arctic sea ice loss.

2. Southern Ocean winds strengthening and moving south

Scientists have confirmed in a study covering the last 1000 years that winds are strengthening in the Southern Ocean and moving south. They found a definite trend greater than can be explained by natural variability and attributable to the effect of increased greenhouse gases.

Hence the drying of southern Australia is expected to continue. Also the tightening of winds around Antarctica inhibits warming of the continent. Nevertheless the warming of West Antarctica is considerable.

3. Antarctic glaciers melting past point of no return

A group of melting glaciers in West Antarctica appears to have reached the point of no return according to scientists from NASA and the University of California Irvine. Even if we cut back greenhouse gas emissions savagely now the melting will continue. We are probably looking at 3 to 5 metres of sea level rise, from Antarctica alone – that is our gift to future generations. Dangerous climate change is no longer just a future possibility, it’s happening now!

The question is, how long will it take? Here there is uncertainty. It could be as short as two centuries or as long as nine. Professor Eric Rignot thinks two centuries is “not outrageous”.

4. East Antarctica more vulnerable than thought

Part of East Antarctica is more vulnerable than expected to a thaw that could trigger an unstoppable slide of ice into the ocean and raise world sea levels for thousands of years, a study showed on Sunday.

The Wilkes Basin in East Antarctica, stretching more than 1,000 km (600 miles) inland, has enough ice to raise sea levels by 3 to 4 meters (10-13 feet) if it were to melt as an effect of global warming, the report said.

The Wilkes is vulnerable because it is held in place by a small rim of ice, resting on bedrock below sea level by the coast of the frozen continent. That “ice plug” might melt away in coming centuries if ocean waters warm up.

“East Antarctica’s Wilkes Basin is like a bottle on a slant. Once uncorked, it empties out,” Matthias Mengel of the Potsdam Institute for Climate Impact Research, lead author of the study in the journal Nature Climate Change, said in a statement.

Wilkes basin could be more vulnerable than West Antarctica, but perhaps on longer time scales. Again there is concern with tipping points. James Hansen famously said, You can’t sling a rope around an ice sheet!

5. Climate change is clear and present danger, says landmark US report

Climate change is already severely impacting US economy, ecology and health, according to the the third National Climate Assessment report. Arid areas will become dryer, moist areas wetter and wildfires and storms will become more frequent and severe. For example floods have increased in frequency, mainly in the Midwest and Northeast:

CS_extreme-precip-index_13263_V9_600

From The Guardian:

Climate change has moved from distant threat to present-day danger and no American will be left unscathed, according to a landmark report due to be unveiled on Tuesday.

The National Climate Assessment, a 1,300-page report compiled by 300 leading scientists and experts, is meant to be the definitive account of the effects of climate change on the US. It will be formally released at a White House event and is expected to drive the remaining two years of Barack Obama’s environmental agenda.

The findings are expected to guide Obama as he rolls out the next and most ambitious phase of his climate change plan in June – a proposal to cut emissions from the current generation of power plants, America’s largest single source of carbon pollution.

Joe Romm at Climate Progress has more, while Emily Atkin looks at the impact on indigenous groups in Alaska and Pacific Islands.

6. Chances of El Niño almost 4 out of 5

The chances of an El Niño developing this year are now at almost 80% according to some estimates. This graph shows the increased temperature in El Niño years.

gistemp_nino_s-600

It could be a warm one.

Parts of the western United States suffering chronic drought could have flooding rains. In Oz where large areas are in drought, there would be even less chance of relief.

7. China, please stop using coal!

China should put a cap on greenhouse gas emissions from coal by 2020, and then swiftly reduce its dependency on the fossil fuel, according to a new study. Otherwise climate change will be impossible to stop.

Of relevance, back in 2011 the IEA said that after 2017 any new fossil fuel power generation should be matched by the decommissioning of equivalent existing capacity.

Reminder: Use this thread as an open thread on climate change.

Climate clippings 92

Climate clippings_175 This is a continuation of the Climate clippings series familiar to readers of Larvatus Prodeo

While this edition was finished about a week ago I actually started writing stuff from about mid-February and have several others queued in the draft bin. They’ll be fed in periodically at the rate of perhaps more than one a week until I catch up with myself.

1. Strong El Niño rated an 80% chance

That’s according to Paul E. Roundy of the University at Albany, New York.

The sub surface temperature of the eastern Pacific Ocean is measuring an ‘astounding’ six degrees warmer than normal for this time of year.

The only time anything similar has happened was in March 1997, before the whopping 1998 El Niño.

An El Niño normally means dry conditions and reduced monsoons in Australia and Indonesia, but wetter weather in Central America.

Climate Progress shows this interesting graph:

gistemp_nino_s-600

Since 1998 there have been six La Niña years warmer than any El Niño years prior to 1998.

At Mashable Andrew Freedman quotes the same people but found at least one scientist who thinks there’s perhaps a 40% chance there will be no El Niño at all.

Worth watching. Could be spectacular.

2. Wave and tidal energy

Climate Progress reports on wave energy projects at Morro Bay in California and elsewhere.

A 2012 report prepared by RE Vision Consulting for the Department of Energy found that the theoretical ocean wave energy resource potential in the U.S. is more than 50 percent of the annual domestic demand of the entire country. The World Energy Council has estimated that approximately 2 terawatts — 2 million megawatts or double current world electricity production — could be produced from the oceans via wave power.

3. The Pacific Ocean is turning sour

Much faster than expected, according to a new study.

Apparently CO2 concentrations are not uniform around the world and the tropical Pacific is getting more than its fair share. Hence the ocean in that area is acidifying faster than elsewhere.

4. Oxfam on food futures

From Huff Post, Oxfam has just completed a report (downloadable here) which suggests that climate change could delay the fight against world hunger for decades. Global food prices could double by 2030, with half the increase attributable to climate change. In the next 35 years there could be 25 million more malnourished children under the age of five than there would otherwise be.

Oxfam analyzed ten gaps that measured how prepared – or unprepared – 40 food-insecure countries are to tackle climate change impacts.

We assess ten key factors that influence a country’s ability to feed its people in a warming world – these include the quality of weather monitoring systems, social safety nets, agricultural research and adaptation finance.

As expected, the poorer countries will be most affected.

5. Will we still be able to have a decent cup of tea?

At the foot of the Huff Post Oxfam link above is a graphic showing the top “endangered” crops listing in order chocolate, coffee, beer (at least in Germany), peanuts, durum wheat to make pasta in Italy, maple syrup, honey, wine (at least in France). It must be said that I couldn’t find that list in the Oxford report which is mainly about staples such as rice and vegetables.

Now it seems that Assam tea is being affected by hotter, drier weather with more erratic rainfall. Indeed tea growing all over the world is becoming more difficult.

There’s more at the BBC.

6. More on global food security

A separate study found that from 2030 onwards, the world’s crop yields will be more and more impacted by climate change.

The study found that Sub-Saharan Africa and South Asia showed significant yield reductions for the second half of the century, while regions of the world with temperate climates, such as Europe and most of North America, could withstand a couple of degrees of warming without a noticeable effect on harvests, or possibly even benefit from a bumper crop.

One of the most important findings of this study is that adaptation may not be as effective for rice and maize as it is for wheat.

7. On the other hand

If you need a more cheerful story, here’s one about peasant farmer Vu Thi Ngoc who has adapted to crazy weather in the uplands of northern Vietnam by growing a different range of crops and changing farming practices.

It shows adaptability at work, this time with the help of CARE and Vietnam’s Agriculture and Forestry Research and Development Centre for the Northern Mountainous Region.

Reminder:

These posts are intended to share information and ideas about climate change and hence act as an open thread.

But as ever, I do not want to spend time in comments rehashing whether human activity causes climate change.