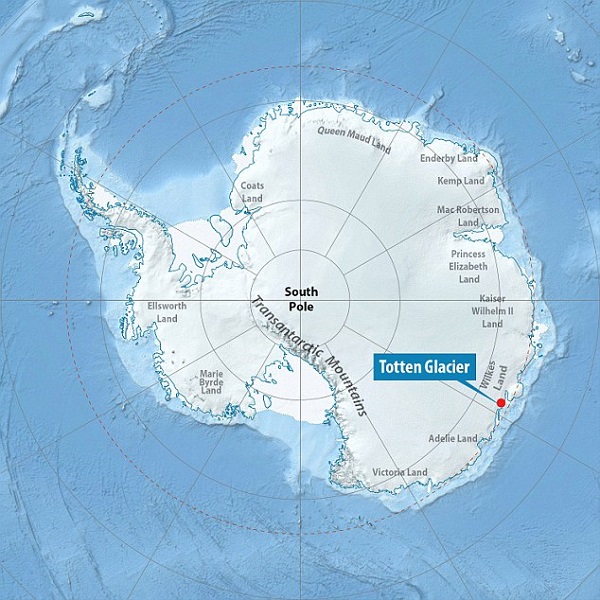
Tag Archives: Totten Glacier

Climate clippings 194

1. Methane emissions spiking

The Global Methane Budget 2016 has been released, and the news is not good.

    CSIRO researcher Dr Pep Canadell said it was the most comprehensive modelling to date and revealed a potentially dangerous climate wildcard.

    “Methane emissions were stable for quite a few years at the end of the 2000s. But they’ve begun to grow much faster, in fact 10 times faster, since 2007,” said Dr Canadell, who is also the executive director of the Global Carbon Project.

Continue reading Climate clippings 194

Ice sheet decay spells danger from sea level rise

think-progress_0-byvq9xmd8g3r6qzl_230In the post Scoping long-term sea level rise I indicated the possibility of 25 metres (±5) of SLR with emissions of 380 (360-400)ppm and a temperature variance of 2.7 to 3.7°C. The question was really how long it would take, and what were the prospects for the next century or three.

The received wisdom seemed to be that we could expect about a metre, by 2100, and some studies limited SLR to about two metres in the next millennium. A new study suggests we could get close to two meters in total by 2100. Moreover the melting of ice on Antarctica alone could cause seas to rise more than 15 meters by 2500. Continue reading Ice sheet decay spells danger from sea level rise

Climate clippings 131

1. Totten Glacier

In Climate clippings 124 I mentioned concerns about Totten Glacier in East Antarctica, which is actively melting. It’s now in the news again. Dr Tas van Ommen:

“We’re realising that the East Antarctic ice sheet’s probably not the sleeping giant that we thought or at least, the giant’s starting to twitch and we’re concerned,” he said.

This article has a map showing the size of the glacier catchment, more than double Victoria:

Totten_6326094-3x2-600

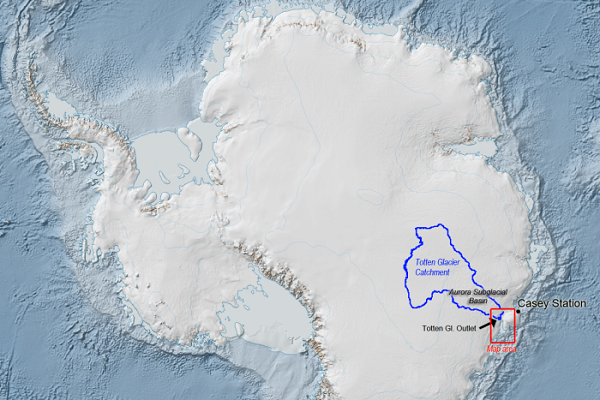
Essentially with East Antarctica on the move, estimations of sea level rise this century could be underdone. We simply don’t know.

2. Great Barrier Reef ‘saved’

The Federal and Queensland Governments have together released the final version of the long-term plan for the Great Barrier Reef.

The Reef 2050 Long-Term Sustainability Plan satisfies one of the key recommendations made by the United Nation’s World Heritage Committee and forms a key plank in the Governments’ bid to avoid the site being declared “in danger” by UNESCO.

The report warns climate change is the biggest long-term threat facing the reef, while the immediate pressures include water quality, which has declined due to nutrient and sediment runoff from agricultural production.

Previously, a draft version of the report was criticised by some scientists as being a plan for sustainable development rather than protecting and conserving the reef.

The Queensland Government also sought urgent changes to the draft, to include its $100 million election commitment to improve water quality.

These news items never mention ocean acidification. As I’ve repeatedly warned:

It has been shown that “preserving more than 10 per cent of coral reefs worldwide would require limiting warming to below +1.5°C (atmosphere–ocean general circulation models (AOGCMs) range: 1.3–1.8°C) relative to pre-industrial levels”.

3. France says new rooftops must go green

According to a new French law approved on Thursday, rooftops on new buildings in commercial zones across France must either be partially covered in plants or solar panels.

France has lagged behind other major European countries like Germany, Italy and Spain in solar power development. As of last summer, France had just over five gigawatts of photovoltaic capacity, accounting for around one percent of total energy consumption. Germany has nearly 40 GWs installed.

France has relied on nukes for 83% of its power.

4. Are the UK’s emissions really falling?

Traditional emissions accounting only considers the greenhouse gases generated within a country’s own borders. In other words, emissions produced in the UK are allocated to the UK. On this measure, UK emissions have fallen dramatically to around 25% below 1990 levels.

But when the source of emissions generated by products consumed within the UK are counted, emissions have only fallen by 7%. This is the pattern over time:

UK emissions_screen-shot-2015-03-19-at-144932_599x299

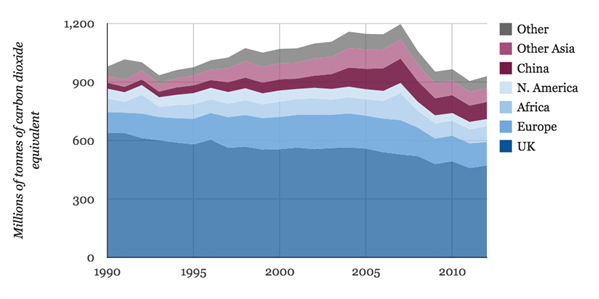
The UK’s production emissions have fallen fast (dark blue area), but imports have offset much of the gain (lighter blues, purples and grey area). Clearly things changed after the GFC in 2008.

5. Germany penalises dirty coal power

Germany plans to force operators of coal plants to curb production at their oldest and most-polluting power stations, as part of efforts to achieve its climate targets, senior government sources said yesterday. Under the measures, the government plans to allow coal plants to produce 7 million tonnes of carbon dioxide per gigawatt of installed capacity, but any produced above that level would be subject to a fine of 18 to 20 euros per ton.

6. Australia’s top ten emitters

Planet Oz takes a look at an ACF report on Australia’s top polluting companies. From the report here they are:

Top 10 polluters_cropped_600

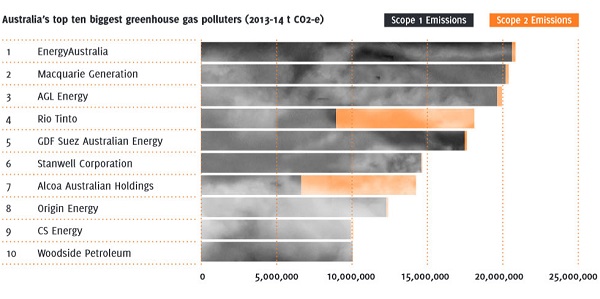
Seven are energy companies, three are miners.

However, if you took the emissions generated from the products they produce, a very different picture would emerge. Rio, for example comes fourth with emissions of 18 million tonnes of CO2 last year. Yet Rio’s customers burning coal produce a further 129 million tonnes.

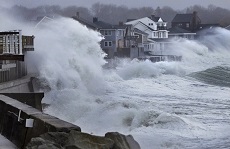
7. Climate change ‘exacerbated’ Cyclone Pam damage

That’s according to the Climate Council, (but see Item 8 below).

“Higher surface temperatures can mean that you have higher wind speed and more damaging rainfall,” Amanda McKenzie from the Council said.

“And what we saw in Vanuatu was in the lead-up to the cyclone, sea surface temperatures were well above average.”

Ms McKenzie said rising sea levels would multiply the damaging effects of cyclone storm surges.

Cyclone Pam, a category-5 storm with wind gusts reaching 300 km/h, struck Vanuatu on 13 March 2015 leaving twenty-four people dead, 100,000 people homeless and up to 70% of the nation’s 69,000 households damaged.

8. Cyclone Pam and Climate Change

Stefan Rahmstorf at RealClimate takes a look at whether climate change had an effect on Cyclone Pam.

My take is, quite possibly, but we can’t know for sure.

The basic problem is that the satellite record only goes back to around 1980, which is not long enough, and only in the North Atlantic are cyclones surveyed by aircraft and then only if they threaten populated regions within a few days.

A study by Kossin et al (2013) looked at the satellite data record from 1982 to 2009 and found an increase of 2.5 m/s per decade for high intensity events (Pam appears to have reached an intensity of around 75 m/s).

Other factors to look out for include the amount of rain delivered, changes in genesis locations and tracks, and diameters, all of which should be affected by climate change.

Haiyan and Pam, two of the most severe tropical cyclones on record, have struck the western Pacific in the past 16 months.

Climate clippings 124

1. Totten Glacier melting from below

Scientists have found that waters around Totten Glacier are warmer than expected and that it is melting from below. Amazingly the glacier, in East Antarctica, has never been studied before.

Totten glacier_251552E400000578-2926354-image-a-31_1422281876786_600

A team of scientists on the Australian icebreaker Aurora Australis has recently taken a look. They don’t have comparative historical data to go by, but the concern is large. Totten is the biggest of the big and holds enough water to raise the sea level 6 metres. That’s somewhere between West Antarctica and Greenland!

2. State of the Climate 2014

The CSIRO and the Bureau of Meteorology have released their State of the Climate 2014 report. There is a summary at the ABC.

One thing that was new was a prediction of more extreme El Niño and La Niña events. They are talking here of extreme La Niña’s appearing once in 13 years rather than once in 23 years. So it’s not the garden variety events, rather the exceptional events.

For the rest of the report, it seems on a quick look to be much as expected – less rainfall in southern Australia, more extreme hot days, less snow, continued ocean acidification, more worries about sea level rise and so on. I’ll take a closer look if I get time.

Graham Readfearn points out that in 1995 at Amberley near Brisbane the mercury climbed above 35C on 12 days per year on average. That could become 55 days per year.

3. Australian sport needs to lift game on climate issues, Olympians and sport bosses say

It has been a year since extreme heat wreaked havoc at the Australian Open, with players forced to endure temperatures over 40 degrees Celsius on the courts.

Some athletes said the conditions were akin to “tap-dancing on a fry pan”.

Unfortunately Tennis Australia are not on their lonesome in forcing athletes to perform in dangerous conditions. There are concerns also for spectators and venues, for example subject to flooding. The Climate Institute has produced a report analysing the vulnerability amongst sports like AFL, tennis, cricket and cycling as well as winter snow sports.

Part of The Climate Institute’s ongoing research into climate risk and resilience, this report will form the basis of ongoing discussions in the sporting world, including with the newly formed Sports Environment Alliance, chaired by former International Cricket Council CEO Malcolm Speed.

4. Keystone showdown and American climate opinion

The Senate has passed legislation approving the controversial Keystone XL tar sands oil pipeline on a 62-36 vote.

asked Thursday about the vote, White House Press Secretary Josh Earnest reiterated that Obama would veto.

The Senate requires 67 votes to overturn a presidential veto.

Meanwhile Carbon Brief takes a look at the gap in opinion between scientists, the public, and politicians on climate change from Pew Center research. This is how it pans out:

Screen Shot 2015-01-30 at 11.04.43

A case of the blind leading the partially sighted.

Across the ditch Hot Topic posts about a book that meticulously goes through the development of climate science from the time of Arrhenius. Seriously, there isn’t an argument any more about the basic science.

5. Economists begin to take climate change, and poverty, seriously

I find this surprising:

current economic models… generally conclude that the economically optimal pathway results in a global surface warming around 3–3.5°C.

Current economic models mainly treat economic growth as an external factor. In these models, global warming and its impacts via climate change don’t significantly affect the rate at which the economy grows.

A new study finds:

while the economies of rich countries continue to grow well in a warmer world, the economic growth of poor countries is significantly impaired.

That’s not so surprising.

The authors find that:

the best path for society would limit temperatures to between 1.6 and 2.8°C warming in 2100, with a best estimate of around 1.7°C warming.

Meanwhile the rulers of the world at the Davos World Economic Forum conference were given a straight message:

In particular, the nexus between climate protection and development is a striking conclusion of the World Bank analysis: without climate stabilization at still manageable levels, development advances, especially in the poorest countries, are set to be reversed. Indeed, development work of past decades (involving significant financial resources) is at risk and with it the well-being of the most vulnerable citizens on Earth.

The “World Bank analysis” is Turn down the heat : confronting the new climate normal, a report prepared for the World Bank by the Potsdam Institute for Climate Impact Research and Climate Analytics.