Tag Archives: Precipitation

Climate clippings 204

1. Antarctic ice melt may have tipped

David Spratt at Climate Code Red has a post surveying recent studies on Antarctic ice sheet melting. I’ll cut to the chase with his update of a recent report from NOAA:

    a revised worst-case sea-level rise scenario of 2.5 metres by 2100, 5.5 metres by 2150 and 9.7 metres by 2200. It says sea level science has “advanced significantly over the last few years, especially (for) land-based ice sheets in Greenland and Antarctica under global warming”, and hence the “correspondingly larger range of possible 21st century rise in sea level than previously thought”.

Continue reading Climate clippings 204

State of the Climate, 2014

Front page_cropped

CSIRO and the BOM have released their State of the Climate 2014 report. Pretty much the same story you’ve heard before, only a bit worse.

There’s a good summary at the special BOM site, where you can download the report. Other than that Climate Citizen has perhaps the best summary.

Graham Readfearn at Planet Oz riffs off the Dorothea Mackellar theme of a “sunburnt country” of “droughts and flooding rains”.

At Radio National’s PM Mark Colvin interviewed CSIRO’s Dr Penny Whetton.

At The Conversation Professor Neville Nicholls emphasises rising heatwaves and fires. Sophie Vorrath has more at RenewEconomy.

I’ll comment on a few sundry aspects.

Level of greenhouse gases

We are told that the global mean for CO2 in 2013 was 395 ppm, or “likely the highest level in at least 2 million years”. Back in the 2012 report the figure of 390 ppm for 2011 was described as “a level unprecedented in the past 800,000 years”. David Spratt at Climate Code Red added a corrective addendum “that should be 15 million years.”

Spratt referenced the work of Aradhna Tripati:

The last time carbon dioxide levels were apparently as high as they are today — and were sustained at those levels — global temperatures were 5 to 10 degrees Fahrenheit [DS: 3 to 6 degrees Celsius] higher than they are today, the sea level was approximately 75 to 120 feet [BB: 23 to 36 metres] higher than today, there was no permanent sea ice cap in the Arctic and very little ice on Antarctica and Greenland.

I’m amazed at how often these reports understate the gravity of the situation, presumably for fear of being written off as alarmist.

The report usefully adds the other main greenhouse gases to give a CO2 equivalence figure:

fig13_600

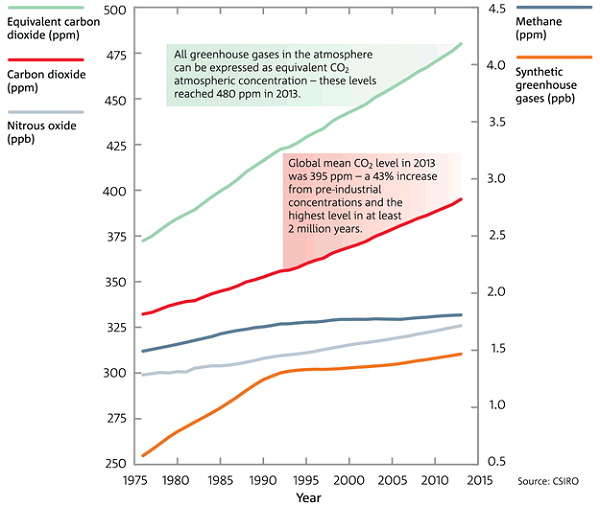
Please note the nitrous oxide and synthetic greenhouse gases are given in parts per billion.

In terms of CO2 equivalence we are now the 480 ppm. We should be red alerts everywhere and an emergency meeting of the G20, or something. The sad fact is that no policy agenda adopted by a political party has aspired to a safe climate. In fact the Garnaut Report and the Clean Energy Future Package legislated by Labor, the Greens and the indies, only ever aspired to 450 or 550 ppm CO2e. James Hansen in nominating 350 ppm as an initial target was very clear that this needed to assume net zero for the other greenhouse gases. What we are committed to now is a very unsafe climate as the effects play out in the short, mid and longer term.

Abbott was going to leave climate change off the forthcoming G20 agenda for Brisbane until the Americans complained.

Prospective temperature increases

Temperatures are projected to rise by 0.6 to 1.5°C by 2030 compared to the climate of 1980 to 1999. Warming by 2070 is projected to be 1.0 to 2.5°C for low greenhouse gas emissions and 2.2 to 5.0°C for high emissions.

We’ll achieve the upper bound if we continue as we are; the lower bound lacks credibility. To the ranges given we need to add 0.6°C in order to obtain the values for change since pre-industrial.

Again, we are clearly heading for dangerous climate change.

At time of writing there was a short piece in New Scientist citing three recent studies which indicate that climate sensitivity may have been under-estimated. Drew Shindell of NASA GISS:

“Sensitivity is not down at the low end,” Shindell says. “We can’t take any solace from warming being slower of late.”

That means we must cut our emissions fast, he says, or the planet could warm by 6°C by 2100.

Warming of 4°C is usually given as the level where civilisation as we know it comes into play. For Australia in a 4°C world, see Gabrielle Kuiper at Climate Code Red.

Hot days and heat waves

This graph shows the incidence of days in a year when the temperature is in the hottest 1% relative to 1910-2013:

fig7_600

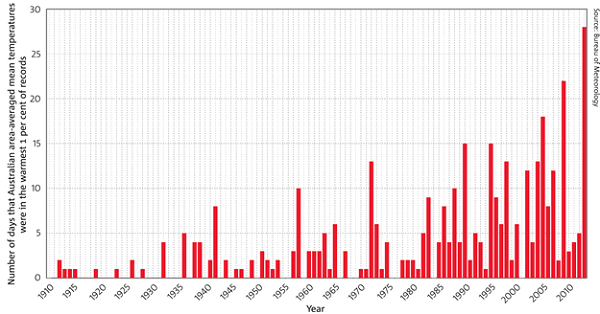
Graham Readfearn points out:

Starting from 1910 when Australia’s records start, it took 31 years for the country to rack up 28 days hot enough to fall into that top one per cent.

2013, however, managed to deliver this same number of extremely hot days in a single year.

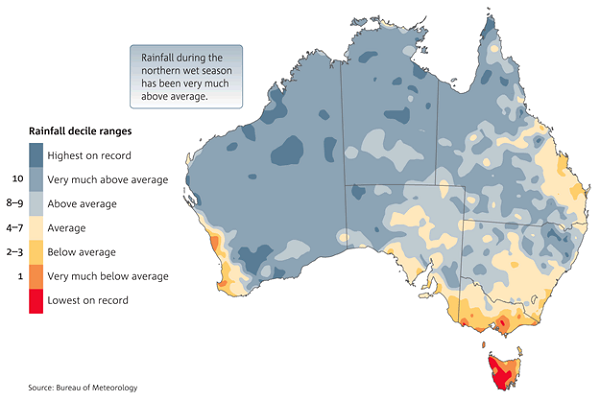
Precipitation changes

The following map shows the rainfall variation in deciles since 1995-1996 for the northern wet season of October to April:

fig5_600

The next map shows the rainfall variation in deciles since 1995-1996 for the southern wet season of April to November:

fig6_600

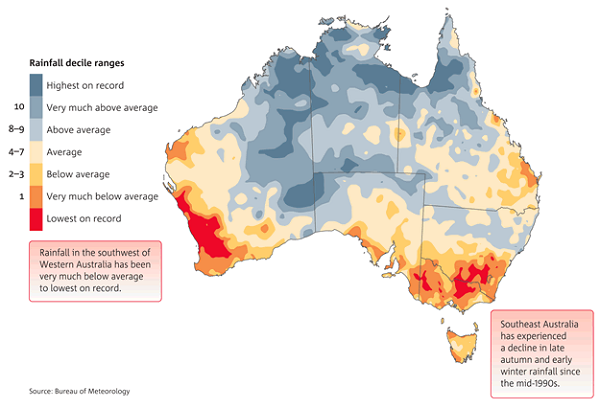
I believe that Sydney, which has dominant autumn/early winter rainfall, sits on the border between the summer and winter rainfall zones.

Clear patterns of change are becoming obvious. Apart from southern areas there is distinct drying in large tracts of Queensland, especially in winter.

This is disturbing:

The reduction in rainfall is amplified in streamflow in our rivers and streams. In the far southwest, streamflow has declined by more than 50 per cent since the mid-1970s. In the far southeast, streamflow during the 1997–2009 Millennium Drought was around half the long-term average.

Could be that we’ll increasingly have to rely on damaging floods to fill our dams.

Conclusion

There’s more, of course, including the prospect of losing our reef ecosystems.

Climate change is upon us.

Climate clippings 79

Climate clippings_175These posts are intended to share information and ideas about climate change and hence act as an open thread. This post has emphasised science, observations and impacts. Comments, about science, observations impacts, and future predictions are welcome. I do not, however, want a rehash of whether human activity causes climate change.

1. SAM and ENSO divorce

Roger Jones at Understanding Climate Risk has a post on global warming breaking the link between SAM and ENSO, with consequences for our weather.

To help, GMT in the graph means ‘global mean temperature’.

wang-cai-fig-3_500

With the global warming signal taken out (top panel), the relationship between ENSO and SAM is strong but with it in, they depart in the late 1960s (lower panel).

There’s also an article in The Age.

From Jones:

So what does this mean for Australia’s climate? It means that an overwhelmingly positive SAM is keeping the westerlies south and contributing to our drier autumn winters and delivering weather typical of the Riverina to southern Victoria according to Cai. Recovery of the ozone layer and reduction in greenhouse gas emission would stabilise this process, rather than continuing to send it south.

In summer it also allows the easterly trades greater access, bringing in more moisture from the tropics and enhancing La Niña summer rainfall. Continue reading Climate clippings 79

Climate clippings 69

1. Electric cars

you have about 750 million cars in the world today; you’re going to have about 1.3 billion cars in about 25, 30 years; and you can’t expect them all to be running on gasoline. There isn’t that much gasoline around.

Stan Correy has a look at the future of the car industry and our potential place in it on ABC RN’s Background Briefing.

Evan Thornley, who is behind Better Place, thinks our niche in the electric car future is in the larger powerful muscle car, where we have always been. Continue reading Climate clippings 69

Climate clippings 64

I’m currently working on another project, which is taking up much of my time. This week we had about 200mm of rain in one day. That could have been why my cable connection to the internet disappeared for 36 hours. I’m grateful to John D who sent me the links for each item in the following except the last.

Zero-emissions engine that runs on liquid air

A new zero-emissions engine capable of competing commercially with hydrogen fuel cells and battery electric systems appeared on the radar when respected British engineering consultancy Ricardo validated Dearman engine technology and its commercial potential.

The Dearman engine operates by injecting cryogenic (liquid) air into ambient heat inside the engine to produce high pressure gas that drives the engine – the exhaust emits cold air. It’s cheaper to build than battery electric or fuel cell technology, with excellent energy density, fast refuelling and no range anxiety. It just might be a third alternative.

Among the advantages are that it doesn’t catch fire or explode and doesn’t require rare materials. Continue reading Climate clippings 64

Climate clippings 52

7 billion and counting

With the world’s population passing 7 billion there have been reports and analysis all over the media.

George Monbiot, clear-headed as usual, says the real problem is consumption. He also takes a look at the UN calculations, and is not impressed, but one way or another the graph is going to go up for about four decades.

Fred Pearce is not an economist, but he may have a point in saying that ageing is the trend and with that your economy goes down the tube. Japan has become the land of the setting sun.

Those two are part of The Guardian’s Crowded Planet series. Our ABC has 7 challenges for 7 billion put together by 7 academics. Continue reading Climate clippings 52

Climate clippings 33

Stormy weather

2010 possibly the worst ever for extreme weather

That’s according to über-meteorologist Jeff Masters posting at Climate Progress.

The year was extraordinary, featuring the hottest year on record equalling 2005, the most extreme winter Arctic atmospheric circulation on record, the warmest and driest winter on record for North America-Canada, the lowest volume of Arctic sea ice on record and 3rd lowest in extent, a record melting in Greenland, the second most extreme shift from El Niño to La Niña, the second worst coral bleaching year, the wettest year over land, the Amazon rainforest experienced its 2nd 100-year drought in 5 years and, it must be said, we had the lowest global tropical cyclone activity on record. Here’s the precipitation graph: Continue reading Climate clippings 33

Climate clippings 28

Joplin tornado

Link between tornadoes and climate change

Recent bad weather in the US, for example the tornado which mashed Joplin, Missouri, has led to many many stories speculating about the link between the intense tornado season and climate change. Joe Romm at Climate Progress takes a measured view:

1. When discussing extreme weather and climate, tornadoes should not be conflated with the other extreme weather events for which the connection is considerably more straightforward and better documented, including deluges, droughts, and heat waves.

2. Just because the tornado-warming link is more tenuous doesn’t mean that the subject of global warming should be avoided entirely when talking about tornadoes.

Joe Romm’s substantive post Tornadoes, extreme weather, and climate change is well worth a read and has lots of comments and links about extreme weather in general as well as tornadoes. Continue reading Climate clippings 28

Climate clippings 16

These posts include a brief mention of a number of news items relating to climate change. They don’t preclude treating any of these topics at more length in a separate post.

They can also serve as an open thread so that we can keep each other informed on important climate news.

Brits view climate change as a current or imminent threat

Fully 83% of them do, as reported at Climate Progress.

The public’s belief in global warming as a man-made danger has weathered the storm of climate controversies and cold weather intact, according to a Guardian/ICM opinion poll published today.

Asked if climate change was a current or imminent threat, 83% of Britons agreed, with just 14% saying global warming poses no threat. Compared with August 2009, when the same question was asked, opinion remained steady despite a series of events in the intervening 18 months that might have made people less certain about the perils of climate change.

So the so-called ‘climategate’ kerfuffle had no noticeable impact on public opinion. Continue reading Climate clippings 16

Climate change and the Murray Darling Basin

With record rainfall in large parts of Australia in recent months there has been a bit of a tendency to think that normal service has been returned. But record rainfall is by definition exceptional. This is how the last three months look on the BOM maps: Continue reading Climate change and the Murray Darling Basin