Tag Archives: Electricity
Energy Storage Using Phase Change Materials
Batteries are not the only way for a house to store energy. This post looks at ways of storing heat and cold directly using phase change materials (PCM’s). They can be more efficient than batteries as a result of storing energy when outside temperatures are closer to target temperatures.
Continue reading Energy Storage Using Phase Change Materials
Climate action 02
COMMENTS ON QCA REPORT ON FEED IN TARIFFS
- When calculating the “fair” FIT the QCA managed to find excuses for not including most of the savings associated with the use of RTS. This made an enormous difference. If these savings are included, the FIT would have to be above 100 cents/kWh before RTS stopped reducing the power bills of Qld householders who don’t have RTS. The QCA exclusions reduced this figure to a measly 8 cents/kWh.
- The difference in estimates highlights the problems associated with having bureaucrats or politicians set the feed in tariff. It also highlights the problem of determining the FIT on the basis of the effect on household power bills.
- This post is not advocating that the FIT be raised to $1.00 kWh. It is suggested that auctions or some other market based system be used to set the FIT.
National greenhouse emissions accounts
Tristan Edis at Climate Spectator makes a valid point that insufficient attention has been given to the increase in mining emissions in our national inventory.
The two graphs displayed represent change in emissions. To provide context we really need to know the total quantum of emissions for each category. So I looked for the source of his graphs.
Turns out there is no one source. You have to go to this page. There is also a search facility here.
Edis has chosen his graphs well to make the points he makes, but some of the impressions may be misleading. Mining is the fastest growing sector but agriculture, residential and manufacturing are all still larger sectors. And residential in his graphs is only about half electricity consumption. The other half is mostly transport, but also includes emissions generated at residences, presumably mainly from gas. There are many messages you can dig out of the mine of information provided online. I’ll try to give a brief overview here.
This table, from the National Inventory by Economic Sector 2009/10 gives a snapshot of Australia’s direct emissions, that is from the point they are generated:
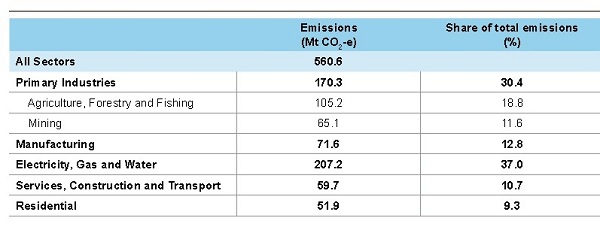
Land use, land use change and forestry (LULUCF) activities are included.
The figure for electricity needs to be largely distributed across the other sectors. For example, the residential figure cited here would comprise only transport plus other emissions generated at homes.
Edis’s first graph is Figure 6 in the Quarterly Update of Australia’s National Greenhouse Gas Inventory: December 2011. I’ll skip it and go to his second graph, which is Figure 7 of National Inventory by Economic Sector 2009/10:
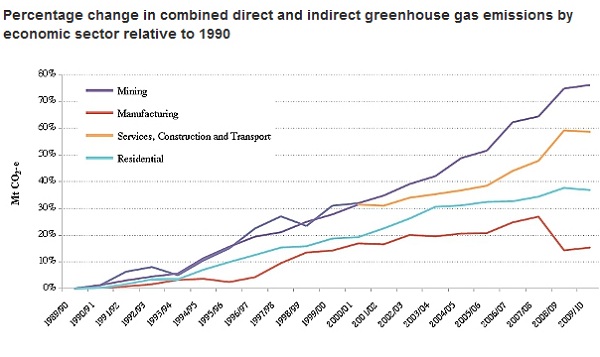
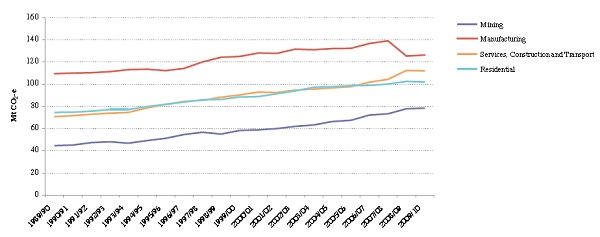
The MtCO2e on the y-axis should have been omitted. Use of grid electricity is included in each sector. Agriculture is left out. It really should have been accompanied by Figure 6:
The graph that best captures everything happening now (at least in 2002-2010) is Figure 8 from the same document (p20). The graph is too big to reproduce here, so I’ve made this table:
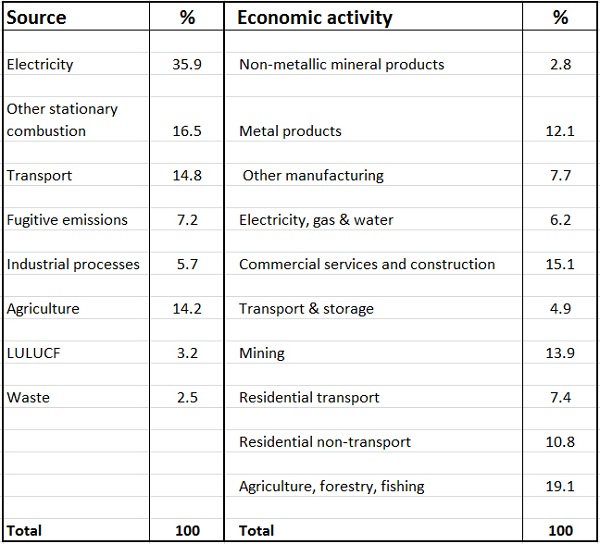
Some thoughts.
Given the size of the electricity sector as a source and its potential in reducing emissions in the transport sector, clearly decarbonising electricity generation would go almost half way towards achieving zero emissions. Tackling electricity generation and transport represent the low-hanging fruit.
We have to ask whether an emissions trading system (ETS) by itself will achieve this in a time frame compatible with avoiding dangerous climate change. Recently I heard on Radio National that the fall in the demand for electricity is effectively locking in coal as a source of baseload power. If this article is correct we are spending $100 billion on a grid which will not be capable of handling diversified power generation.
This article is one of many detailing the falling electricity demand and some of the implications.
From the National Inventory by Economic Sector document, Figure 3 gives the direct emissions for each state:
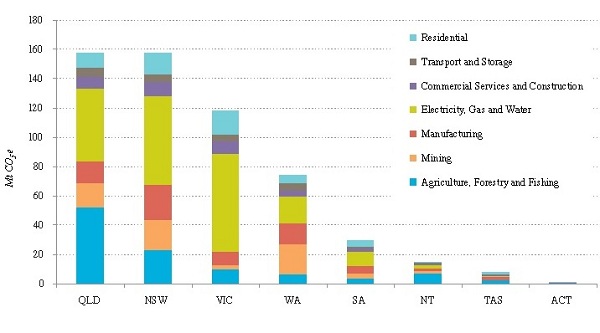
Queensland would be the champion in per capita terms.
The Queensland LNP Government has decided to axe the policy and programs section of the Office of Climate Change. ‘Can-do’ can do whatever he wants!
Climate clippings 27
Solar power could crash Germany’s grid
Harnessing the sun’s energy could save the planet from climate change, an approach that Germany has readily adopted. Unfortunately, this enthusiasm for solar panels could overload the country’s ageing electricity grid.
Installed capacity is such that a huge surge can occur when the sun comes out. What’s needed, they say, is an electricity grid that can equalise inputs from the wind of the north to solar in the south.
(Please note the article dates from October 2010.) Continue reading Climate clippings 27
