
This edition includes important updates on Greenland and Antarctica, global food supply, CSIRO cuts, CO2 levels moving decisively past 400 ppm and CO2 compared to global temperature rise.
1. Greenland may melt faster than expected
You may recall from the post Arctic images I included an image of the underlying topography of Greenland (Figure 5). It is saucer-like with large areas inland below sea level. The glaciers tend to drain through narrow gateways in the external rim. So they tend to be narrow and fast-flowing:
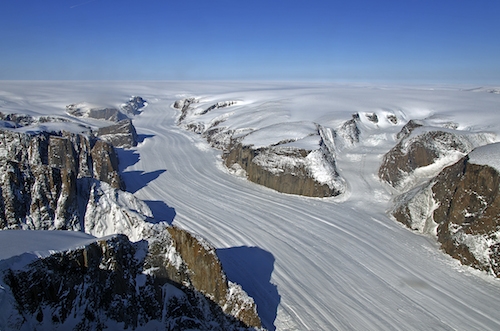
The mouths of most glaciers are melting from contact with warmer seas. It was felt that as this process continued the ice would lose contact with the water, slowing the melting.
New studies of the topography have shown that many of these channels are below sea level.
Valleys underlying many of the glaciers stay below sea level and extend much farther inland than previously suggested, so warm ocean currents that have migrated northward with the changing climate could eat away at the ice for much longer than current climate models suggest. “It will take much longer for these glaciers to lose contact with the ocean,” study author Mathieu Morlighem, of the University of California, Irvine, told Climate Central.
2. Melting Antarctica could devastate global food supply
A new report is the “first to factor in the effects of the slow-motion collapse of the Western Antarctica ice sheet on future food security.”
About time, I’d say.
The report acknowledges recent findings that that the retreat of the Western Antarctica ice sheet was unstoppable – and could lead to sea-level rise of up to 4 metres over the coming centuries.
“That sea-level rise would take out half of Bangladesh and mostly wipe out productive rice regions in Vietnam,” Nelson told The Guardian. “It would have a major effect on Egyptian agricultural areas.”
“A sea level rise of 3 meters (10 feet) over the next 100 years is much more likely than the IPCC thought possible,” the report said.
In terms of absolute land loss, China would be at risk of losing more than 3 million hectares (7.4 million acres). Vietnam, India, Bangladesh, and Myanmar could lose more than 1 million hectares (2.5 million acres), the report said.
The report recommends a radical increase in expenditure on agricultural research, which has been in decline everywhere over recent decades.
3. CSIRO cuts
The federal government cut CSIRO’s funding by $111 million over four years, which will result in 500 job cuts.
Dr Borgas [president of the CSIRO Staff Association] said a plan to move the Aspendale Laboratories to the organisation’s larger site in Clayton had been previously discussed but had come to nothing.
He said it was unclear whether the relocation would reduce the research performed by the 130 staff, which includes ice core analysis, air quality and pollution research and climate and atmospheric modelling.
Most countries planning for a future increase their scientific research funding.
4. CO2 levels decisively pass 400 ppm
During April all 12 World Meteorological Organisation northern hemisphere monitoring stations passed the 400 ppm mark, the first time ever. This is how such a level compares to the 800,000 year ice core record:
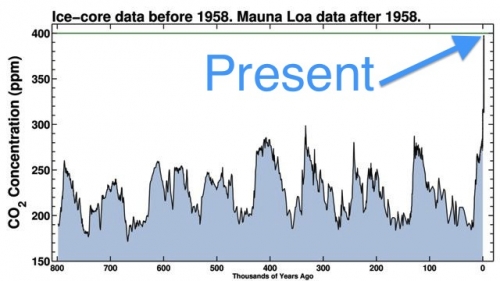
When was it last this high? Possibly 15 million years ago, when it was warmer and there wasn’t much ice around.
“This was a time when global temperatures were substantially warmer than today, and there was very little ice around anywhere on the planet. And so sea level was considerably higher — around 100 feet [30 metres] higher — than it is today,” said Pennsylvania State University climate scientist Michael Mann, in an email conversation. “It is for this reason that some climate scientists, like James Hansen, have argued that even current-day CO2 levels are too high. There is the possibility that we’ve already breached the threshold of truly dangerous human influence on our climate and planet.”
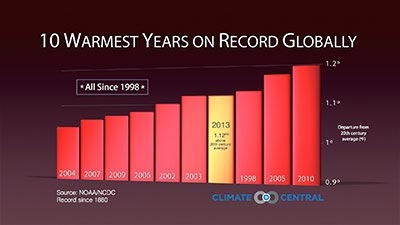
5. Global temperature and CO2
I came across this graph from the NOAA National Climatic Data Center plotting CO2 levels against temperature rise. While correlation does not mean causation there is simply no alternative explanation.

If you take out 1998, which can be regarded as an outlier, the socalled ‘pause’ is only apparent from 2005, which is too short a time to mean anything.
There is another view which sees temperature responding in step-wise fashion. On that basis we may be due for another step, and with an El Niño likely…
Here’s one showing the ten warmest years on record, all since 1998:
Reminder: Use this thread as an open thread on climate change.