 1. Climate clippings reaches 100
Generally speaking I don’t rate the number 100 much except that it’s the number after 99 and the number before 101. Which might be just as well because when I was going through all the posts after transporting them (thanks tigtog) from Larvatus Prodeo I found two with the same number. So the 100th edition was actually number 99!
If you like to laugh Graham Readfearn has assembled 11 climate change comedy video clips to celebrate his 50th post on Planet Oz. I can recommend John Oliver and Australians for Coal, for example. There’s a bad language warning on the latter.
Huffpost has 9 Political Cartoons That Put Climate Change In Perspective:
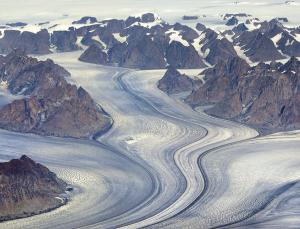
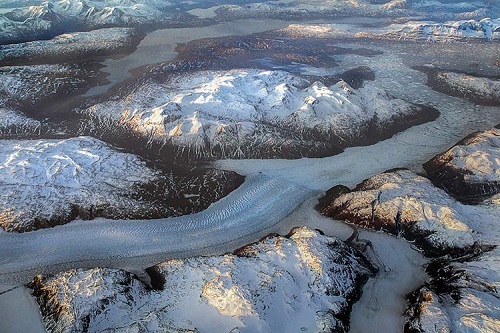
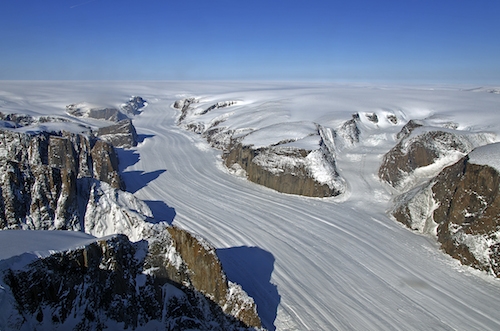
2. Dust increases Greenland’s ice melt
A ‘normal’ Greenland summer melt is illustrated by the left-hand panel taken at 8 July 2012, when about 40% of the ice sheet was subject to melting.
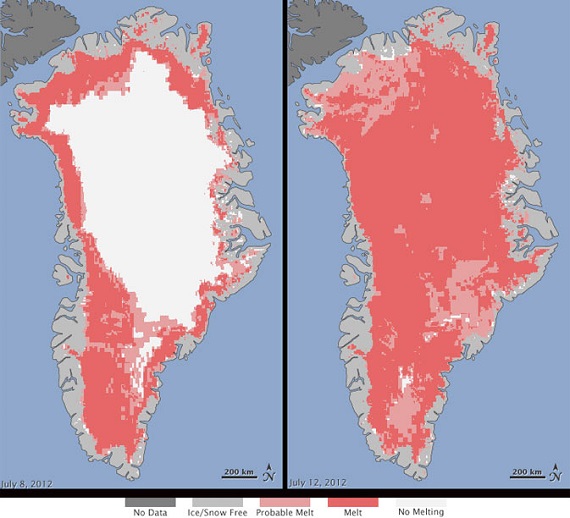
The right-hand panel shows what happened for about a week thereafter and is not relevant except as a harbinger of things to come.
A new study looks at the increased melting from dust and soot. It found that a relatively minor decrease in the brightness of the ice sheet could cause double the average yearly rate of ice loss seen over the period 1992-2010.
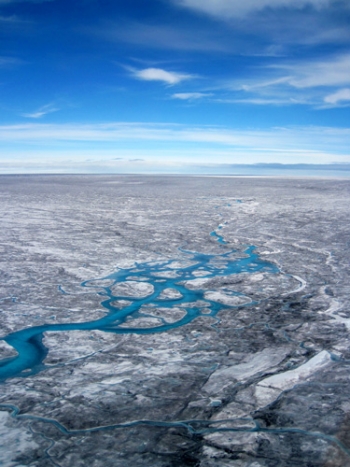
Soot resulting mainly from wildfires in North America and Russia has a greater melting impact than dust as such. However, increased dust is being produced in the Arctic and finding its way to the Greenland ice. Now 150 times as much dust as soot has been found at a site in the north-east.
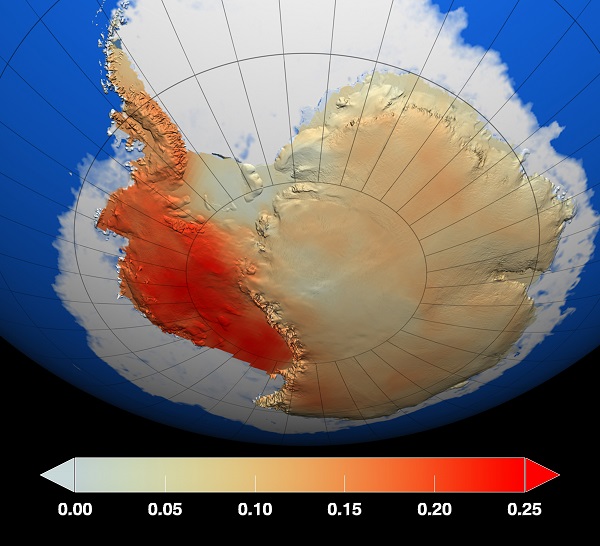
While this can’t be extrapolated to the rest of the ice sheet, there is concern that Greenland melting could be greater than previously thought. See also Antarctic images for context.
3. Green jobs declining in Australia
Yes green jobs are declining in Australia:
Australia is one of the few places in the world where green jobs are decreasing according to figures released by the International Renewable Energy Agency.
Globally the sector now provides an estimated 6.6 million jobs, an increase of 800,000 from 2013 figures, but in Australia, jobs across solar photovoltaics and solar heating have declined, with up to 22 per cent of jobs lost in PV and 20 per cent in heating, according to Ethical Jobs general manager Michael Cebon.
This is happening:
entirely the result of government policy, both through loss of incentives at the federal level and backpedalling by state governments.
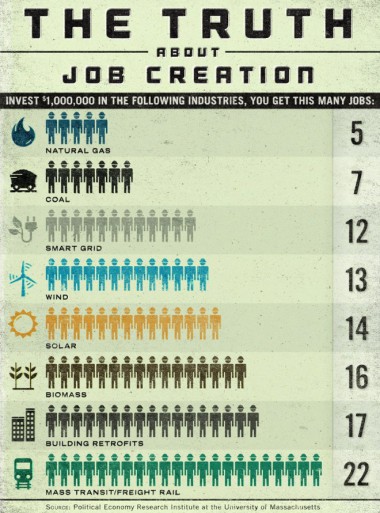
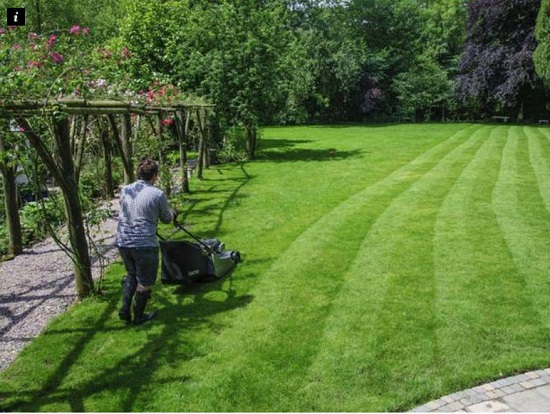
While a structural shift is occurring in the workforce elsewhere, Australia is regressing. The graphic shows the jobs potential of investment in various sectors:
4. Climate change impacts will ‘cost world far more than estimated’
That’s according to Lord Stern. He says that:
the economic models that have been used to calculate the fiscal fallout from climate change are woefully inadequate and severely underestimate the scale of the threat.
That includes those cited by the IPCC. They ignore the science, the full range of risks and simply assume away some of the worst economic impacts.
5. Historians will look back and ask ‘why didn’t they act?’
That’s the question asked by science historian Naomi Oreskes in her
latest book, The Collapse of Western Civilization: A View from the Future, [which] imagines a Chinese scholar in 2393 analysing the slow-motion disintegration of 21st-century democracies as they fail to tackle a growing environmental catastrophe.
It’s not a pretty picture.
By the end of the book, co-written with fellow historian Eric Conway, the Netherlands and Bangladesh are submerged, Australia and Africa are depopulated, and billions have perished in fires, floods, wars and pandemics. “A second dark age had fallen on Western civilisation,” Oreskes writes, “in which denial and self-deception, rooted in an ideological fixation on ‘free’ markets, disabled the world’s powerful nations in the face of tragedy.”
Oreskes and Conway say it’s a worst-case scenario, not a prediction.
One way or another, the game is up, we need to act with vigour and determination.
6. Coal to fuel human progress for decades – Tony Abbott
Our fearless leader has been strutting his stuff on the world stage, ignoring the science and embarrassing us all. He told Texan business leaders that:
we don’t believe in ostracising any particular fuel and we don’t believe in harming economic growth.
“For many decades at least, coal will continue to fuel human progress as an affordable energy source for wealthy and developing countries alike.”
Under the fig leaf of Direct Action anything goes.
Meanwhile Julie Bishop confirms that climate change won’t be high on the G20 agenda.
Once again they are out of tune with the nation. In a recent opinion poll 57% of those polled said the government should take climate change more seriously.
while more than half of respondents felt the federal government was the primary body which should address climate change, there was a negative rating of -18 when people were asked to rank the government’s performance.
This compares to a -1 rating from last year. These rankings are the differential between respondents’ “good” versus’ “poor” response to the government’s performance.
Reminder: Use this thread as an open thread on climate change.
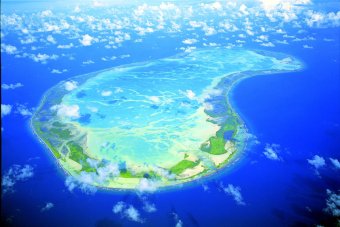
7. Pacific presidents speak out against Australia’s stand on climate change
Out in the Pacific they are not happy with Abbott’s policy stance. The sea is coming up and they are going down. Here’s Fanning Island in Kiribati:

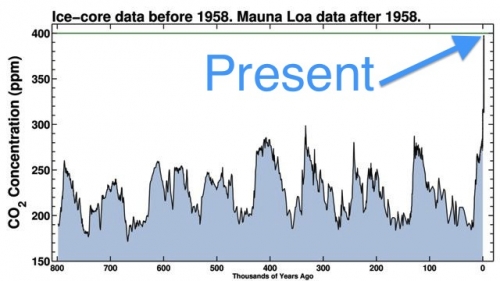
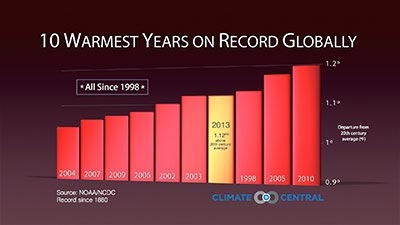
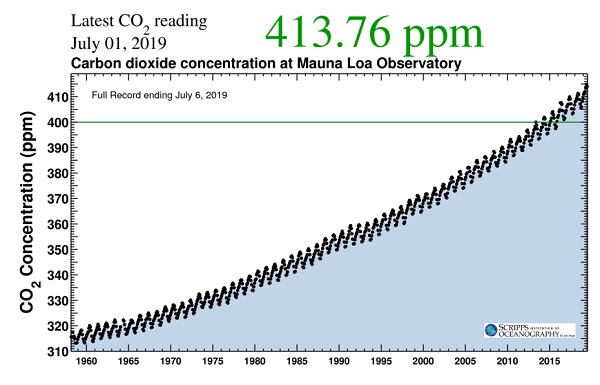 Continue reading Four graphs that matter in the climate emergency
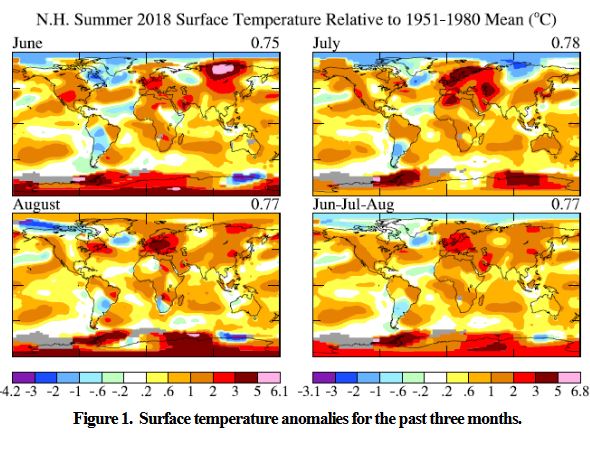
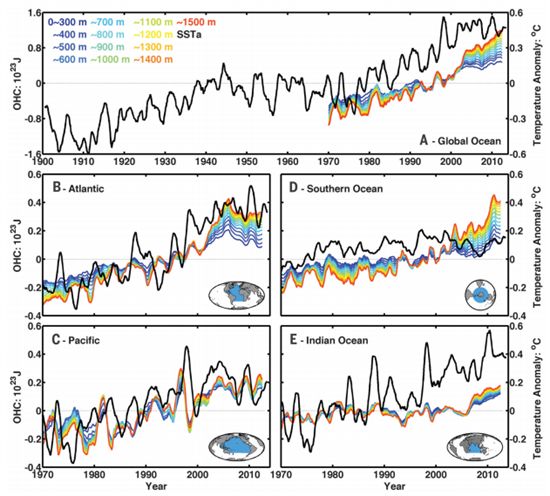
 James Hansen worries that “we may be approaching a point of no return, a situation in which our children inherit a climate system undergoing changes that are out of their control, changes that will cause them irreparable harm”. He’s looked at the models, at current observations, and at what happened during

