
September’s global temperature confirmed that we are living in the hottest year on record. Here’s the map:
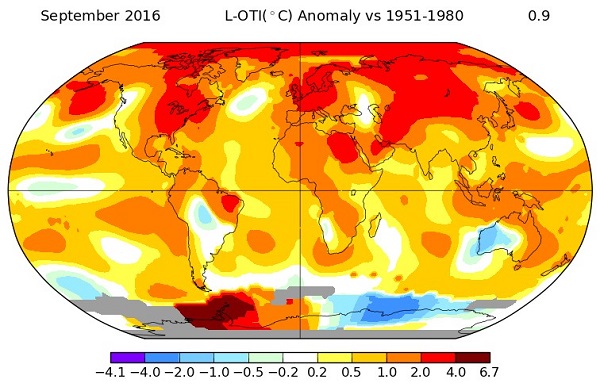
NASA tells us that the record-warm September means 11 of the past 12 consecutive months dating back to October 2015 have set new monthly high-temperature records. June has been down-graded to third hottest, because of late cold temperatures reported from the Antarctic. Also September was only a slither warmer than 2014. It’s the long-term trends that count. So let’s look at the 30-year moving average from Open Mind:
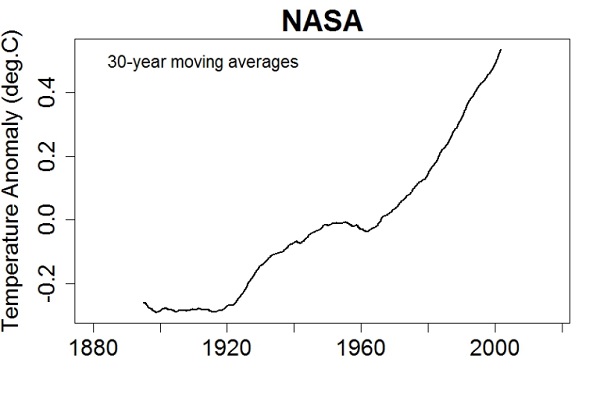
This graph from August shows the extraordinary surge over the last few years:
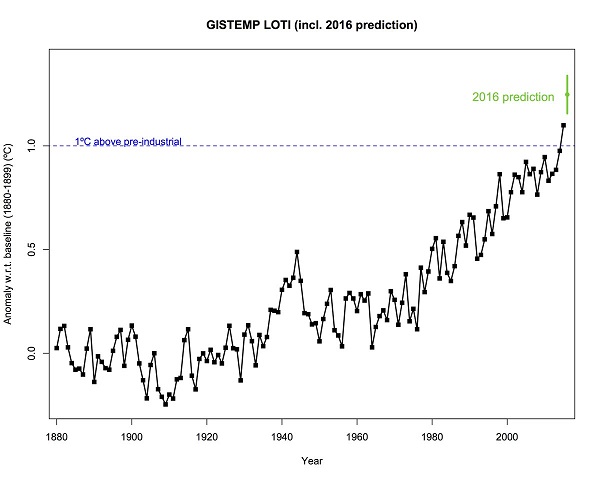
That 2016 prediction is now pretty much locked in at 1.25°C above pre-industrial.
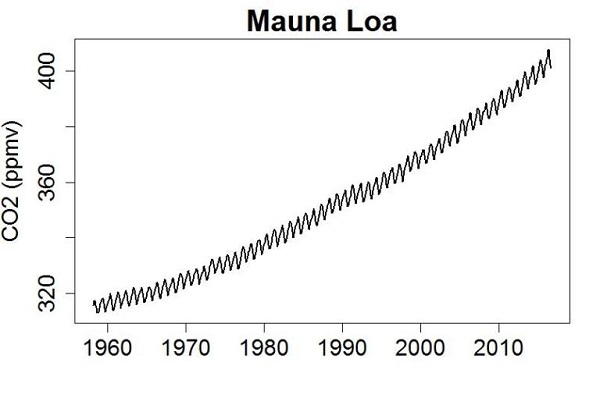
Unfortunately CO2 emissions are similarly forging an upward trajectory, with no sign of faltering:
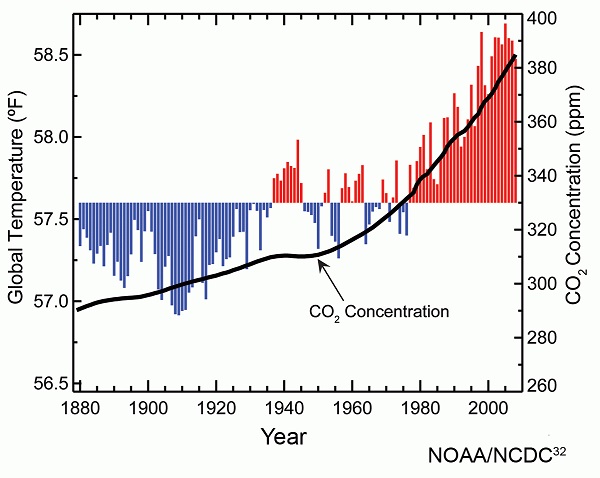
Here, just for fun, is CO2 plotted against temperature, to 2009:
The ‘cold blob’ below Greenland is not as noticeable on the September chart, however, it is a longer term feature, studied and reported on by Stefan Rahmstorf at RealClimate. Here’s a more detailed image from 6 October this year:
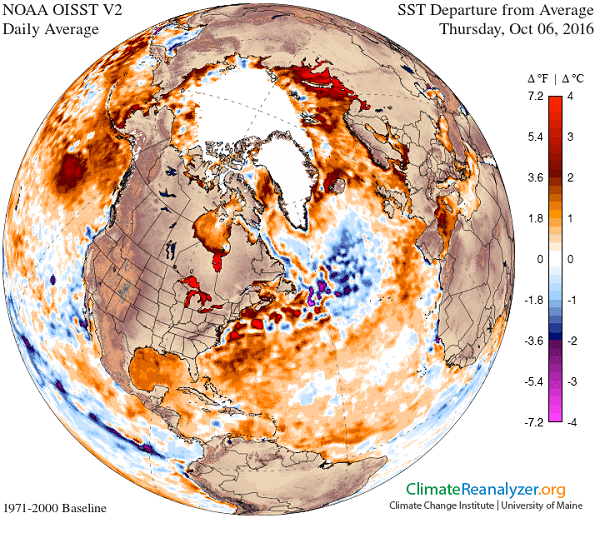
Rahmstorf reports on a recent conference in Reykjavik on the topic What’s going on in the North Atlantic? In 2015 temperatures in the blob area were the lowest on record, while global temperatures were a record high.
Apparently the current IPCC models don’t include the freshwater melt coming from Greenland. Rahmstorf and others are not arguing that Greeenalnd melt is the largest cause of the blob, rather that it is a significant and growing contributor that hasn’t been taken into account. He says that 13,000 cubic kilometers of meltwater have come from Greenland since the beginning of the 20th century. (The total ice sheet is approximately 2,900,000 km3.*)
The big concern is the slowing of the so-called AMOC (Atlantic Meridional Overturning Circulation). We know that as the AMOC flows towards Europe evaporation through the prevailing winds makes it saltier and hence more dense. The sinking saltwater drives the AMOC.
The simple bottom line is that we don’t know at what cumulation or annual input of freshwater a tipping point will be reached. Some scientists now think the AMOC may be less stable than previously thought.
However, the slowing Gulf Stream and the cold blob are already having an effect:
The potential impacts are increasingly studied, here just briefly a few examples. Haarsma et al. (2015) argue on the basis of model simulation that the weakening of the Gulf Stream system will in the future be the main cause of changes in the atmospheric summer circulation over Europe. Jackson et al. (2015) found that a slowdown is likely to lead to increased storm activity across Britain and parts of mainland Europe. And a new study by Duchez et al. (2016) connects the ‘cold blob’ in the summer of 2015 to the heatwave across Europe that year, because the cold subpolar Atlantic favors a certain air pressure distribution.
Incidentally, we are told that the input of freshwater hardly has any direct effect on temperature:
its effect is rather via the dilution of the sea water with freshwater, which reduces the density and thereby hinders the sinking of the water which drives the AMOC.
Presumably the AMOC then brings less warm water up from the south.
I suspect that the main worry for the next few decades is the effect the cool blob is having on the economy and the lives of half a billion people in Europe through storminess, heatwaves and droughts.
* Decimals confuse me, but I think a cubic kilometre of water weighs a gigatonne, and the Greenland ice sheet is losing about 250 gigatonnes per annum.
Seems the ice loss over the last 10 years may have averaged about 270 gigatonnes per annum.
I’m only guessing Brian but looking at it I suspect that the “Cold Blob” is less dense melt water mix and the much denser gulf stream is flowing underneath it, keeping the pool corralled (just a tropical coral islands hold fresh water), only to rise and continue on into the Arctic Ocean. The worst outcome is for this warm current to be pushed down to a depth where it releases methyl hydrates from the continental shelves.
BilB, my best guess is that the thermohaline circulation is near the surface in quite deep water when it traverses the cold blob zone.
There is more to earth.nullschool.net than meets the eye.
Here are the:
keyboard shortcuts
e show the menu
escape close dialog/menu
k go forward one time step
shift-k go forward several time steps
j go backward one time step
shift-j go backward several time steps
n go to now (the most recent data)
i go up one pressure level
shift-i go up to the stratosphere
m go down one pressure level
shift-m go down to the surface
g toggle the grid on/off
p toggle the animation on/off
shift-z enable/disable high definition mode
e opens a screen where you can configure what you want to see and i and m allow you to look at various altitudes by pressure level.
Many thanks to its creator.
I wonder if he can create a money flow version?