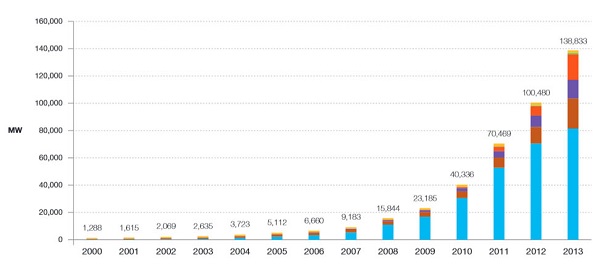
1. Home solar power plus battery storage
It’s on the way, according to reports in Climate Progress and RenewEconomy. They are reporting on reports emerging from HBSC, Citigroup and UBS, so the big end of town is taking notice.
Initial interest is in short storage to cater for the peaks, but it seems that full storage systems will become competitive before the end of the decade.
For the next ten years battery technology is likely to remain lithium ion, with newer technologies introduced later.
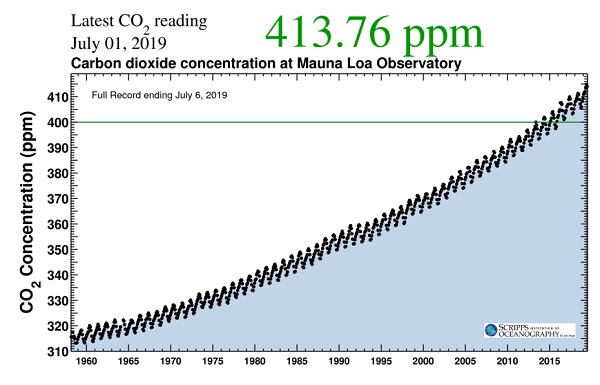
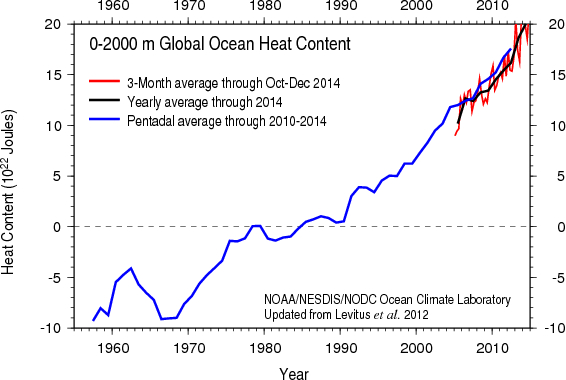
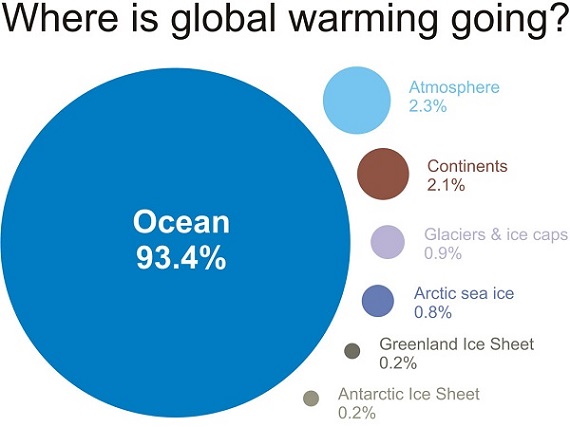
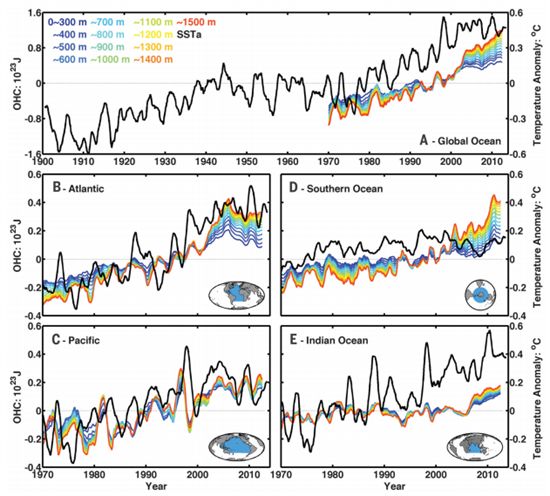
2. Oceans warming faster than thought
The top 700 metres of the ocean have been warming 24 to 55% faster since 1970 than previously thought. The problem has been poor sampling in the Southern Ocean.
Of course this means that the whole planet has been warming faster than previously thought, since over 90% of the extra heat goes into the ocean.
3. Human hands caused 2013 heat
To me 2013 seems like a long time ago, but it is remembered for breaking a lot of heat records in Australia.
January 7 was our hottest day on record – 40.3°C.
January was the hottest month on record.
The 2012-13 summer was the hottest on record.
September was the hottest on record, exceeding the previous record by more than a degree; this was the largest temperature anomaly for any month yet recorded.
September-November was the hottest on record.
The whole year of 2013 was the hottest on record.
Five studies have now been done establishing human agency in these events. We don’t just need to be concerned about our grandchildren. Climate change caused by humans is happening now.
4. NOAA explains record Antarctic sea ice growth
First of all the record does not represent a dramatic increase on the recent average:
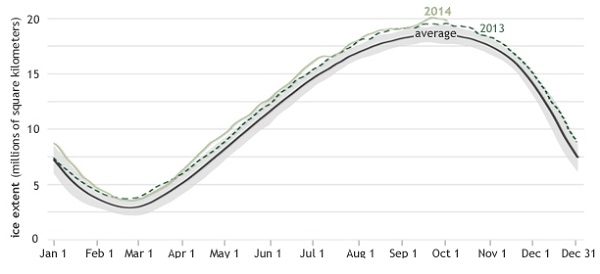
By comparison the loss of land ice has tripled in the last five years alone.
NOAA have now given a more detailed explanation of how the increase, counterintuitively, may be related to global warming. Firstly, it’s the wind:
NOAA first points out that “much of this year’s sea ice growth occurred late in the winter season, and weather records indicate that strong southerly winds blew over the Weddell Sea in mid-September 2014.”
Secondly, the melting land ice itself may have an effect:
Most of Antarctica’s ice lies in the ice sheets that cover the continent, and in recent decades, that ice has been melting. Along the coastline, ice shelves float on the ocean surface, and much of the recent melt may be driven by warm water from the deep ocean rising and making contact with ice shelf undersides.
How does the melting of land ice matter to sea ice formation? The resulting meltwater is fresher than the seawater. As it mixes with the seawater, the meltwater makes the nearby seawater slightly less dense, and slightly closer to the freezing point than the ocean water below. This less dense seawater spreads out across the ocean surface surrounding the continent, forming a stable pool of surface water that is close to the freezing point, and close to the ice onto which it could freeze.
5. Marshall Islands expendable
The United Nations chose 26-year-old Marshall Islands poet and mother Kathy Jetnil-Kijiner to be among the keynote speakers at the UN’s climate summit in New York recently. Here she is at the mike with her husband and child:

Marshall Islands sits on average about 2 metres above sea level. Already she’s seen waves crashing into their homes and their breadfruit trees wither from salt and droughts.
Jetnil-Kijiner was confident in her speech that, no matter how difficult, climate change would be solved, and her daughter would be able to go on living in the Marshall Islands.
“No one’s drowning, baby,” she said. “No one’s moving. No one’s losing their homeland. No one’s becoming a climate change refugee…We are drawing the line here.”
She said, accurately I think, that saving the Marshall Islands meant “ending carbon pollution within my lifetime.”
Some 125 world leaders were present. Some, like ours stayed away, having more important things to do. Anyone present with half a brain must have known that is not going to happen. The Marshall Islands is expendable.
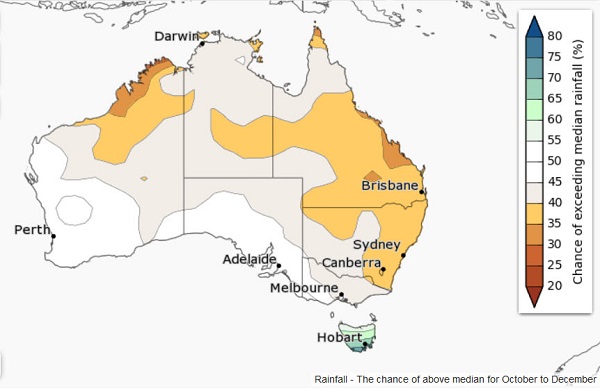
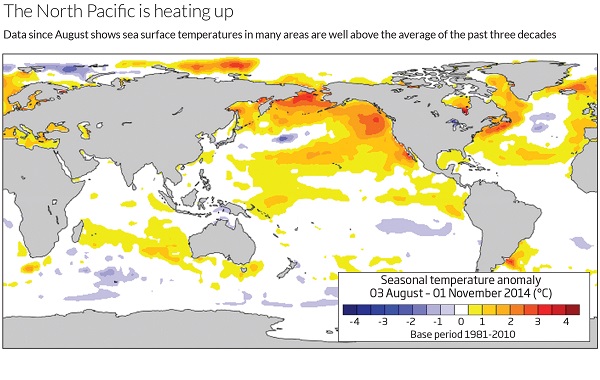
6. Climate outlook, October to December
In brief, warmer and drier than average, apart from Tasmania, which looks good for rain. There’s more detail and maps here.
This is what the rainfall prospect looks like:
And maximum temperature:
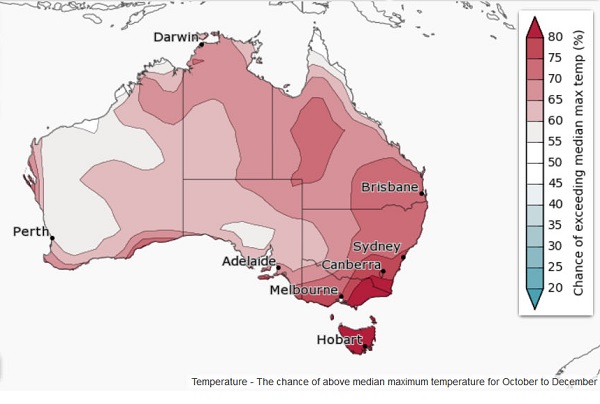
Six of eight international climate models suggest a late season El Niño, or near El Niño, ENSO state is likely.

 Continue reading Four graphs that matter in the climate emergency: bonus edition
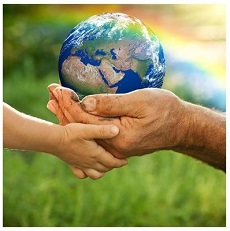


