Adding to the muddle? The IPCC climate change mitigation report

Gareth at Hot Topic has a neat summary of the key points of the IPCC Working Party 3 report: Climate change mitigation report, which I’ve numbered:

    1. Annual greenhouse gas emissions have risen 10 GtCO2eq between 2000 and 2010, and half of all emissions since 1750 have occurred in the last 40 years
    2. If no further actions are taken to reduce emissions global mean surface temperature in 2100 will increase by 3.7 to 4.8°C compared to pre‐industrial levels
    3. To have a reasonable chance of staying under 2ºC of warming in 2100 means restricting greenhouse gases to 450 ppm CO2eq
    4. Hitting 450 ppm CO2eq will mean “substantial cuts in anthropogenic GHG emissions by mid‐century through large‐scale changes in energy systems and potentially land use”
    5. Typical 450 ppm CO2eq scenarios include overshooting the target and then removal of CO2 by bionenergy with carbon capture and storage (BECCS), though “carbon dioxide removal (CDR) technologies and methods are uncertain and CDR technologies and methods are, to varying degrees, associated with challenges and risks”
    6. The Cancun pledges are not consistent with cost-effective efforts to hit 2ºC, and are more likely to commit the world to 3ºC of warming
    7. The sooner we act, the cheaper overall mitigation will be – as little as 0.06% of annual GDP growth to hit 450 ppm CO2eq.

The “substantial cuts” in point 4 are in fact 41 to 72% by 2050.

In point 5 the cuts required by 2100 are 78 to 118%. That is, the upper bound requires greenhouse gases to be removed from the atmosphere. This will give a “likely” chance of staying below a 2°C increase in temperature over pre-industrial. In IPCC parlance, likely means a 67% or better chance.

This is not “reasonable” as suggested in point 3, it’s reckless.

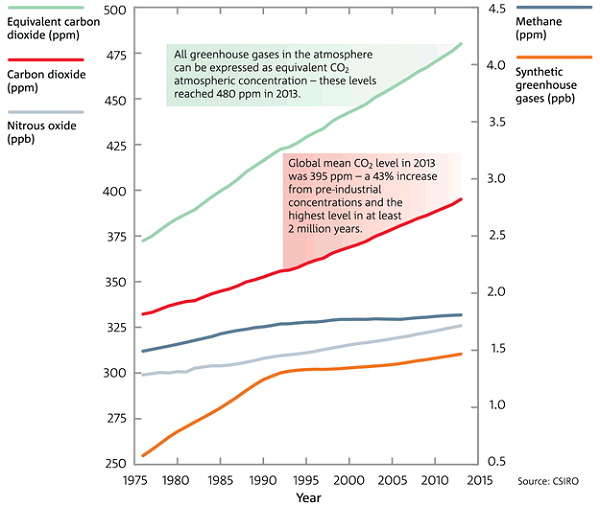
I’m surprised at the lack of urgency in the report and the modesty of the targets. A 67% or better chance, considering the risks associated with a 2°C increase, amounts to miserable odds. Moreover, as the CSIRO/BOM State of the Climate 2014 report indicated, we are already at 480 CO2eq ppm:

fig13_600

To make matters worse, the chances of staying under 3°C and 4°C are also only rated in the report as “likely”.

Our current situation demands the ambition and urgency called for by Professor John Wiseman, Deputy Director of the Melbourne Sustainable Society Institute at the University of Melbourne:

He concludes that we need more ambition and urgency, both at the national and international levels. The achievement of emission reductions at the necessary scale and speed will require transformational rather than incremental change.

Wiseman goes for a three-phase emissions reduction target regime.

First, a 50% reduction target by 2020.

Second, zero net emissions by 2040.

Third, a carbon draw-down phase to get concentrations below 350 CO2e ppm.

Again, my view:

I applaud his ambition, but, personally, would change the date of the second to 2030 and put a date of 2050 on the third. That is, we should aim for 350 CO2e ppm by 2050.

Professor Kevin Anderson of Manchester University and the Tyndall Centre thinks policy makers are in a muddle about the 2°C target. I’m not sure this IPCC mitigation report helps all that much. Furthermore, I think it misleads rather than promoting a safe climate.

The WG1 science report identified the remaining carbon budget we have to work with to stay below 2°C. Rather than elaborate the carbon budget approach, which I described in the second part of this post, the mitigation report lays out a range of scenarios which involve both overshooting and the use of carbon dioxide reduction (CDR) technologies.

In my view policy makers who concentrate on a less than 95% chance of remaining under the 2°C threshold (I’d prefer 1.5°C) should be immediately sacked and replaced by others more fit to purpose. Scientists writing this report have left the real challenge to the politicians, but by normalising scenarios that lack urgency I fear policy makers will descend into a bigger muddle than ever.

This graph from Malte Meinshausen displayed in the Climate Change Authority report on targets is salutary, considering we are at 480 CO2e ppm:

Stabilisation probabilities_cropped_600

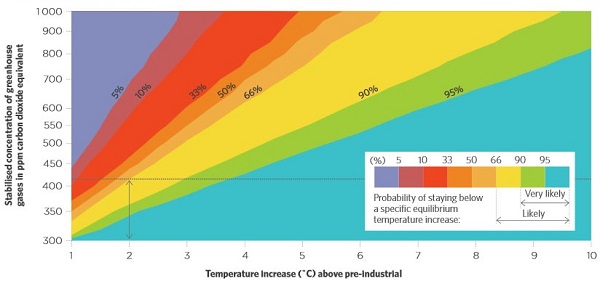
For a safe climate, the line on the graph should be drawn where 2°C intersects with 95%. That would call for greenhouse gas concentrtions of less than 350 ppm. Back in 2008 David Spratt and Philip Sutton in the book Climate Code Red nominated 320 ppm as the target for a safe climate. They called the 2007 Fourth Assessment Report of the IPCC “dangerously conservative”. Not much has changed.

Remember James Hansen nominated 350 ppm not as an end target, rather as an interim goal, whereupon we could decide the next necessary move.

The sad fact is that scientists are not looking at scenarios of 430 ppm or below by 2100. There are too few in existence for the IPCC to summarise.

In describing stabilisation pathways the IPCC collated 900 individual scenarios with target CO2 concentrations (for 2100) of 430 to 720 ppm. They then summarised the scenarios in seven categories (see table SPM1 on page 13 of the Summary for Policy Makers). It’s too large to reproduce here.

The first category, the best we are offered, has the following story line.

To achieve CO2e concentrations of 450 ppm (range 430-480) cumulative emissions from 2011 to 2050 must be in the range of 550 to 1300 GtCO2. By 2100 cumulative emissions must be in the range of 630 to 1180 GTCO2. Please note that the upper bound for 2100 is less than for 2050. This will require a reduction of emissions compared to 2011 of 41 to 72% by 2050 and 78 to 118% by 2100. The resulting temperature change will be 1.5 to 1.7 (1.0 to 2.8) relative to pre-industrial. This will give only a 50% plus chance of staying below 1.5°C and a better than 66% chance of staying below 2°C. There is up to a 33% chance that the temperature will go above 3°C and indeed 4°C.

The temperatures in brackets indicate the uncertainties of how the models relate to reality. In fact at section 6.3.2.6 in the main report we are told that the report’s “probabilistic temperature statements should be regarded as indicative.”

The second category uses a target of 500 ppm (480-530), which only yields a “more likely than not” chance of staying below 2°C, that is >50%. Each category summarises a proportion of the 900 scenarios modelled. Each individual scenario is different depending on whether cuts in emissions are made early or late.

From there it obviously gets worse.

Scientists may be dealing with expected reality, but they have left the real challenge of dealing with the climate to the politicians. Moreover, the action required for a safe climate, as outlined by Wiseman, lies outside the frame of the stabilisation pathways outlined in this report. Approaches such as the International Energy Association’s (IEA) World energy Outlook 2011 highlighting an energy crunch for fossil fuel power generation by 2017 probably has more effect.

Key posts

These are the key earlier posts linked above:

Additional reading

Here I’d highlight the article at The Conversation by David Stern on concerns that the IPCC report was censored. This is a misunderstanding of the process. The main report includes a Technical Summary which is prepared by scientists. The Summary for Policy Makers is about a third the length and results from a political filter applied at the end. The material left out, according to Stern, relates to sensitivities and bargaining positions in the current round of UNFCCC talks aimed at striking an international agreement in December 2015 in Paris.

There’s more on the report at Climate Institute, at at Climate Central, at The New Scientist here and here, and at the BBC.

Carbon Brief went wild, producing a dozen posts which I’ve listed here for the record. I’d recommend the first two by Robin Webster for a quick overview, but Ros Donald on fracking and Mat Hope on acronyms may be of particular interest.

13/4 What’s mitigation? A short and straightforward summary of the IPCC’s latest report Carbon Brief staff

13/4 Not just another climate report: main messages from the UN report on tackling emissions Robin Webster

13/4 The what, when and where of global greenhouse gas emissions: A visual summary of the IPCC’s climate mitigation report Mat Hope

13/4 From RCP to WG3: A climate change acronym cheat sheet Mat Hope

14/4 Does the IPCC endorse fracking? Ros Donald

14/4 Climate fixes and Plan Bs: The IPCC’s guide to staying below two degrees of global warming Roz Pidcock

14/4 Media reaction: The Intergovernmental Panel on Climate Change’s big climate mitigation report Ros Donald

14/4
Daily Briefing | IPCC: There’s still time to take climate action, if countries cooperate
Carbon Brief staff

15/5 Degrees of change: the IPCC’s projections for future temperature rise Robin Webster

16/4 Tackling global warming could slow global growth – by 0.06 per cent, IPCC predicts Mat Hope

17/4 IPCC review of farming and forests leaves key questions about effect on climate change “unresolved” Robin Webster

17/4 Climate change is a political animal Paul Tobin

Independent Australia also looks at fracking and gas.

Developing countries are unhappy.

Please contribute other useful links in comments.

Saturday Salon 10/5

voltaire_230

An open thread where, at your leisure, you can discuss anything you like, well, within reason and the Comments Policy. Include here news and views, plus any notable personal experiences from the week and the weekend.

For climate topics please use the most recent Climate clippings.

The gentleman in the image is Voltaire, who for a time graced the court of Frederick II of Prussia, known as Frederick the Great. King Fred loved to talk about the universe and everything at the end of a day’s work. He also used the salons of Berlin to get feedback in the development of public policy.

Fred would only talk in French; he regarded German as barbaric. Here we’ll use English.

The thread will be a stoush-free zone. The Comments Policy says:

The aim [of this site] is to provide a venue for people to contribute and to engage in a civil and respectful manner.

On a mission to upset everyone

Having upset the rich with their ‘debt levy’, and with 72% of people thinking it a broken promise, Abbott and Hockey are on a mission to upset the rest of us by re-indexing the fuel excise.

Richard Denniss told the 7.30 Report that the tax was good policy.

Sinclair Davidson told Waleed Aly that if you must tax, then taxing consumption is better than taxing production. The fuel excise taxes consumption. He forgets that sole traders (like me) driving a ute or a van would pay the tax. Nevertheless the LNP backbencher Ken O’Dowd in the linked article appears to be wrong:

A Federal Government MP has spoken out against plans to raise the fuel excise, warning it will force up the cost of everyday groceries.

Farmers and miners don’t pay fuel excise. That tax concession is worth some $13 billion, which the Greens would like to abolish.

Davidson also pointed out that fuel excise was a regressive tax, it disadvantages the poor. Those with time to ring up are letting Mr O’Dowd know:

“The phones haven’t stopped, especially with our older folk. We got off on the wrong leg, talking about increasing the pension age, I don’t think it was explained too good. It really concerned a lot of old people that they were going to lose their rights.”

It hardly matters now what the budget detail turns out to be – the damage has been done.

Meanwhile company directors are losing faith. Only 30% of company directors expected the new administration to have a positive impact on their business decision making, down from 70% when the LNP took over. Furthermore:

This loss of confidence has also translated into a fall in the proportion of directors who believe the Federal Government understands business – from 55 per cent last year to 48 per cent now.

Fully 80% say that achieving a budget surplus in the next three years is not a priority.

Wayne Swan says he left the budget in good shape. Chris Bowen has been saying that Joe Hockey has doubled the deficit by changes to Government spending and changes to Government assumptions. The ABC FactCheck verdict:

Since the election, the official forecast deficit has doubled. The economic assumptions are different from those used before the election, and spending decisions have been made that were not in the previous forecasts. Mr Bowen’s claim checks out.

Here’s the table that tells the story:

PEFO_cropped_600

The PEFO of August 2013, prepared independently by Treasury and Finance, shows a surplus for 2016-17. Leaving aside Hockey’s moral austerity crusade, it does appear that he has confected the crisis.

War is good for us!

Eventually, that is. Unless we are killed, starved, raped, maimed, robbed or otherwise damaged in the process.

The proposition is simple:

War has been good for something: it has produced bigger societies, ruled by stronger governments, which have imposed peace and created the preconditions for prosperity.

Through war humanity is now safer and richer than ever before.

That’s the central thesis of historian Ian Morris’s book War! What Is It Good For? according to his article in the New Scientist (paywalled). (There is a similar article in the Chicago Tribune.)

Mind you he says “war is probably the worst way imaginable to create larger, more peaceful societies” but “it is pretty much the only way humans have found.”

From our position in the 21st century we see the 20th century as the most violent ever. Indeed, Morris says, we killed between 100 and 200 million of our own kind. Yet 10 billion lives were lived in that century, meaning the the death rate from violence was only 2 to 3 per cent.

By contrast in the Stone Age an estimated 10 to 20% of people died at the hands of another human. Comparable was the experience of the Serbs in WW1 where one in six perished.

In traditional societies:

Most of the killing was on a small scale, in homicides, vendettas and raids, but because populations were also small, the steady drip of low-level killing took an appalling toll.

This graphic shows ‘progress’ over the millennia:

Violent deaths _29650201_450_cropped

Since 2000, the United Nations tells us, the risk of violent death has fallen still further, to 0.7 per cent.

Ten thousand years ago people lived on average 30 years and got by on the equivalent of less than $2 per day. Now the respective global averages are 67 years and $25 per day.

Morris says that virtually every species is programmed for violence. Fukuyama in his The Origin of Political Order quotes archaeologist Stephen LeBlanc:

Much of noncomplex society human warfare is similar to chimpanzee attacks. Massacres among humans at the social level are, in fact, rare occurrences, and victory by attrition is a viable strategy, as are buffer zones, surprise raids, taking captive females into the group, and mutilation of victims. The chimp and human behaviors are almost completely parallel.

Humans, however, with more lethal weapons were more deadly.

Jared Diamond in his book The World Until Yesterday has several chapters on war, but I’d like to quote a study he cites of homicide over the period 1920-1969 amongst the !Kung people in the Kalahari. The !Kung are recognised as peaceable people.

The study identified 22 killing over 49 years, or less than one every two years. It’s just that the population under study was only around 1500. That makes the homicide rate triple that of the United States and 10 to 30 times that of rates for Canada, Britain, France and Germany.

Killing was a norm and in that society.

The graphic shows an increase in violent deaths during what Morris terms the ‘age of migrations’, from AD200-1400. This was a time when Fukuyama would say social/political organisation in Europe had moved beyond the tribal, but had not yet achieved the form of the modern state. It was not a time when the state competently and fairly extracted taxes from all and applied them consistently for the general good. Tom Holland in his book Millennium describes how rulers saw it as their mission to Christianise the heathen but they did this by plundering and bringing home the loot. There was a zero sum attitude to economic growth. You accrued great wealth by taking it from other people.

Castles became popular in the tenth century, not to guard against external threat, but as a base to plunder and extract tribute from the surrounding countryside. Knights were the primary agents, mailed thugs and at that time, Holland says, by definition in a state of sin.

People became increasingly competent at conducting war, with a map that was extremely fluid. During the Thirty Years War German territories lost about a third of their population. In Brandenburg, the seed state of Prussia, it was a half. Yet between times there were periods of peace and prosperity, with an increasing idea that the competent state was there to serve the welfare of the people.

Morris says we used war and killing, because for humans it was the only way. What he doesn’t appear to emphasise is the other side of human nature, the co-operative, altruistic side, which on his evidence is gradually triumphing.

By some counts we have only had the modern state in its full form since WW1.

I could be doing Morris an injustice, as I have not read the book. In The Wall Street Journal Felipe Fernadez-Armesto has some reservations.

Climate clippings 95

Climate clippings_175

1. Pacific winds slow global warming

A team of Australian scientists has found that stronger winds in the Pacific are slowing global warming (paper here, paywalled).

The study found that the winds were churning the Pacific like a washing machine, bringing the deeper colder water to the surface and pushing the warmer water below.

Scientists do not expect the effect to last. Matthew England of the University of New South Wales:

“The phase we’re in of accelerated trade winds particularly lasts a couple of decades,” Professor England said.

“We’re about 12 to 13 years in to the most accelerated part of the wind field.”

There’s more at The Conversation, at Open Mind plus Matthew England at RealClimate and Mike Mann at Huff Post.

The heat is only at a depth of 100 to 300m, so may easily become available to the atmosphere again. Mike Mann thinks the winds and the La Niña effect may be the result of global warming.

2. Animals and plants on the move

The CSIRO have developed a fascinating map showing species on the move due to climate change. I’ve done a screenshot here, but the animated version in the link is best:

species migration copy_cropped

Blue areas indicate significant change and pink areas show “corridors” where animals and plants may be able to move through to more favourable conditions.

“Sink” areas, in orange, show where the movement of land-based species is likely to hit a dead end, by reaching a coastline or mountain range.

Something strange is happening in the middle of Queensland.

3. The year’s weather in 8 minutes

Gareth at Hot Topic has posted a live map of the weather for 2013 as seen from weather satellites. I recommend using the full screen button.

It’s interesting not so much for 2013, but as an overview of how the global system works.

4. Half new energy is green

Fully 44% of all generating capacity installed last year around the world was renewable, says the latest UNEP Global Trends in Renewable Energy Investment, despite a 14% decline in renewables investment, and in new electricity generally.

Europe has cut investment in renewables by 44%. China now leads with $56 billion invested last year.

Shares in clean energy companies rose 54% last year.

5. Germany turns to brown coal

Germany has more wind turbines and solar panels than any other industrialised country, but it also burns more brown coal (lignite) than any other.

As Germany turns off its nuclear power, gas is expensive and a third of it comes from Russia. In these circumstances Germany is turning to lignite to solve the intermittency problem. Because lignite takes 8 hours to fire up plants are run at 40% whether needed or not.

There are three options:

  • storage systems, such as pumped water or hydrogen
  • improving and extending electricity grids so that surpluses can be moved to areas of need
  • organising tariffs to manage demand from big energy users that have intermittent demand.

None of these is being implemented so far to the extent that makes a real difference.

6. Energy use in UK and Germany

Germany generates considerably more energy than the UK, even when population is taken into account.

This graph shows the source of Germany’s power generation for the first quarter of 2014:

Germany_screen-shot-2014-04-30-at-153528_549x170

Nuclear, being phased out over a decade, is a considerable source. Biomass is larger than gas.

Renewable energy is expected to be the main source of electricity generation in Germany by 2030, but policy in both countries is a concern:

In the UK, the Conservative party has recently announced that it will put a cap on onshore wind expansion if it gets into power in 2015. Subsidies for solar power are also likely to be cut, according to media reports – suggesting that Conservatives are increasingly hostile to plans to expand renewables.

In Germany, the government’s putting in place a new renewables plan – possibly in response to concern about rising energy prices. The new rules mean from 2017 energy providers will no longer get guaranteed prices for their power, according to media reports. The effects are unclear, but could slow the growth of German green energy.

7. But then, in Germany at least…

…energy policy is very complex.

In Germany governments attempt to control markets, it seems.

Germany’s energy transition – the Energiewende – has largely been a bottom-up grassroots movement over the past 25 years. Citizens and energy cooperatives account for roughly half the investments. Large utilities are only just now getting on board.

Current changes in policy are aimed at tipping the balance back towards the large corporates, while keeping renewable energy development on track. Policy is also favouring offshore rather than onshore wind.

The article mentions that discussion will now turn to “capacity payments”. I suspect such payments will be necessary to provide backup capacity for intermittency problems, especially if weather forecasts are wrong. For continuity of supply the corporates may have to be paid for unused reserve capacity.

Reminder: Use this thread as an open thread on climate change.

Beware of right wing revolutionaries calling themselves conservatives

Rob Burgess had an interesting post in the May 2 Business Spectator on the commision of audit.  He discusses the competing, and very different ideological positions dividing the political right  as well as pointing out that “Australia has more to lose from radical change than just about any country in the world.”
The competing ideological divisions within the right wing of Australian politics might be described as:

  1. The revolutionary neo-liberal position that says that “the system is fundamentally flawed and needs fixing.”   Their preferred fix are the radical steps required to remove the the restraints on our economy caused by the “dead hand of government.” Vs
  2. The conservative liberal position that says we are actually doing quite well and we should limit our efforts to incremental change.   They might say something like: “In this situation it doesn’t make sense to be risking our gains by making unnecessarily dramatic changes.  If you like: “If it aint broke why fix it?””

There is a similar division on the left of politics between those who want radical change (Think the end of capitalism) and those who favour incremental improvements.

The key question here is whether the current state of the Australian economy really justifies the sort of radical fix advocated by the Audit Commission.  A comparison between Australia and other developed countries might be a good start:

  1. According to The Conversation, Commonwealth net debt “is about 11% of GDP, the third lowest in the OECD (the average is 50%), and low by historical standards”    Not a crisis. 
  2. Rob Burgess provided the following:
    • Combined federal, state and local tax rates ran at a bit over 30 per cent during the Howard years, dropping to  about 27 per cent during the Rudd/Gillard years. (State taxes account for around 4 per cent of GDP, and local taxes (rates) hover around 1 per cent of GDP.)  By comparison, Singapore’s total tax-to-GDP ratio is around 14 per cent, the US 27 per cent, Switzerland 29 per cent, and Canada 32 per cent.  Not a crisis  but it would be interesting to know the reasons behind the low Singaporean rate.  It is worth noting that people may actually be better off in a “high taxing” country if the high taxes mean that the state pays for services that other, lower taxing countries make people pay for themselves.
    • In terms of GDP corrected for purchasing power parity (PPP) we rank 10th on the World Bank and IMF scales. We could do better.  A key factor here is how expensive it is to rent/buy a house in Australia compared with places like the US or Spain where house prices were really hit by the GFC.  In our case, the problem really took off when Peter Costello offered negative gearing to people who could afford to borrow money to buy investment properties.  His first home buyer schemes also tended to push up the price of houses rather than help first home buyers.   However, fixing home prices is no win territory.  It is a bit challenging to please existing homeowners and new home buyers at the same time when it comes to prices.

    • Australia does much better when we use the ‘human development index’, which factors in longevity (as a proxy for good health), educational attainment, gross national income and, in recent years, measures of inequality. On that scale we jostle for the number one spot with Norway. Not 6th or 10th. Number one.  Definitely not a crisis.

    • Best news of all is that last year’s Credit Suisse survey  showed Australia having the highest median wealth per adult citizen of any nation.  Definitely not a crisis although inflated home prices may have helped a bit here.

Conclusion: Australia’s alleged budget crisis is either the product of a fevered imagination or a deliberate attempt by neo-liberals to justify the imposition of their questionable ideas.

None of this mean that there aren’t many things in Australia that would benefit from radical change.  However, the case for these radical changes should be justified by fact based, logical conversations about the specific issues.  Definitely not based on ideological assertions about the dead hand of governments or private is best.

Saturday Salon

voltaire_230

An open thread where, at your leisure, you can discuss anything you like, well, within reason and the Comments Policy. Include here news and views, plus any notable personal experiences from the week and the weekend.

For climate topics please use the most recent Climate clippings.

The gentleman in the image is Voltaire, who for a time graced the court of Frederick II of Prussia, known as Frederick the Great. King Fred loved to talk about the universe and everything at the end of a day’s work. He also used the salons of Berlin to get feedback in the development of public policy.

Fred would only talk in French; he regarded German as barbaric. Here we’ll use English.

The thread will be a stoush-free zone. The Comments Policy says:

The aim [of this site] is to provide a venue for people to contribute and to engage in a civil and respectful manner.

Climate change impacts: IPCC Working Party 2 report

On 31 March the IPCC released its second report in the current series, this one on Impacts, Adaptation and Vulnerability. Follow the links from the report website. We looked at the first report, The Physical Science Basis here, here and here. The third report, Mitigation of Climate Change is now also out, and the final Synthesis Report is scheduled for in September. The series comprises the Fifth Assessment Report.

The IPCC was formed in 1988 and produced assessment reports in 1990, 1995 and 2007. As Graham Readfearn says, the message is the same – we are going to hell in a handbasket – and yes, at that level it’s becoming monotonous.

There is a change, however. It lies in the fact that the impacts of climate change are now all around us. We are not just getting warnings, we are living climate change. The impacts we see locally are integrating into a global pattern, which also includes large-scale transforming events, such as the drying of the Sahel and the loss of sea ice in the Arctic. Increased extreme weather is becoming part of the common experience. In this we are on a path where one in 100 events in any year may become one in three or five. We risk losing whole ecosystems such as the coral reefs where many are in trouble now and all will be by about mid-century, almost certainly. Finally, there is much greater certainty that climate change is happening and about our agency in it. With that certainty comes greater risk, but also opportunity to take action to adapt and to mitigate.

I’ve patterned that paragraph on Greg Picker’s explanation to Steve Austin, while changing the order of the points he made and adding some detail.

The report is organised into two “volumes”, with the first containing 20 chapters, including, for example, one on Human health: impacts, adaptation, and co-benefits and one on Human security. These sectoral reports will provide valuable reference material for years to come.

The second volume comprises 10 “regional aspects” including the ocean.

One of the 10 is on Australasia.

Impacts on Australia

Chapter 25 identifies eight significant impacts for Australia:

  • There is the possibility of widespread and permanent damage to coral reef systems, particularly the Great Barrier Reef and Ningaloo in Western Australia.
  • Some native species could be wiped out.
  • There is the chance of more frequent flooding causing damage to key infrastructure.
  • In some areas, unprecedented rising sea levels could inundate low-lying areas.
  • In other areas, bushfires could result in significant economic losses.
  • More frequent heatwaves and temperatures may lead to increased morbidity – especially among the elderly.
  • Those same rising temperatures could put constraints on water resources.
  • Farmers could face significant drops in agriculture – especially in the Murray-Darling Basin.

University of Queensland marine scientist Ove Hoegh-Guldberg worries that reefs could be severely damaged or disappear by mid-century.

A worst case scenario could see agricultural production reduce by 40% in the Murray-Darling Basin, and in south-east and south-west Australia. The National Irrigators Council says that’s why you have irrigation. However, there is a lot of dry-land farming in these areas and the future average rain is more likely to come in the form of floods when most of the water flows through to the sea.

The above scenarios are risks rather than certainties. However, they add up to a strong chance of dangerous climate change.

Increased certainty

The change in certainty in the attribution of climate change to human activity is conveyed in this image from Dr Jeff Masters’ WunderBlog last year:

IPCC_version95_600

Back in 1990 we saw the possibility of continuing change but what we had experienced at that time could easily have been natural variations subject to reversal. In any case there was low confidence that we could do anything to mitigate. Furthermore, why take measures to adapt, when there was no real certainty?

Now the story has changed dramatically. The pattern and the dominant causes are clear.

Adaptation

From page 27 of the Summary for Policymakers we find a graphic packed with information about various aspects of the impacts of climate change (sorry the graphic is too large to display here!) In the right hand column we find bar graphs showing the present, near-term (2030-2040) and the long-term (2080-2100) risk with hatching to show potential for mitigation through adaptation. The long-term risk is displayed in separate 2°C and 4°C bars.

Little adaptation is possible with Australia’s coral reefs, none at 4°C when the risk becomes very high.

Terrestrial ecosystems losing ice cover in the polar regions are similarly not amenable to adaptation and become very high risk at 4°C.

Loss of crop productivity becomes very high risk at 4°C with little possibility of adaptation. Ditto for heat-related mortality in Asia, North America and, presumably, elsewhere.

Burning embers

The extensive detail in these tables is summarised in a new improved version of the ‘burning embers’ diagram, shown below:

Burning embers_cropped

From this we can readily see that the 2°C ‘guardrail’ marks a fairly arbitrary point on the gradation from dire to downright dangerous.

Elites rule

The USA can no longer be considered a democracy, according to a Princeton University study. Researchers Martin Gilens and Benjamin I. Page argue that America’s political system is effectively an oligarchy, where wealthy elites wield most power.

Using data drawn from over 1,800 different policy initiatives from 1981 to 2002, the two conclude that rich, well-connected individuals on the political scene now steer the direction of the country, regardless of or even against the will of the majority of voters

They say:

“The central point that emerges from our research is that economic elites and organized groups representing business interests have substantial independent impacts on U.S. government policy,” they write, “while mass-based interest groups and average citizens have little or no independent influence.”

This phenomenon has been a long term trend, at least from 1980, with no difference depending whether Democrats or Republicans were in power. The phenomenon is therefore part of the natural order of things, hard to perceive let alone change.

Ordinary folk also have wins, but only when the elites agree.

Questions raised include why, how do you define ‘elite’ and is the American experience replicated here?

As to why, I can only point to two factors. Firstly, the lobbying industry is alive and well. Big Pharma are said to have more lobbyists on Capitol Hill than there are politicians.

Secondly, I recall in reading about trade matters some 10 years ago that very few Democrat senators were not dependent on business support to finance their campaigns.

In this interview author Martin Gilens identifies the role money plays in the political system and the lack of mass organizations that represent and facilitate the voice of ordinary citizens. Interestingly they found that

policies adopted during presidential election years in particular are more consistent with public preferences than policies adopted in other years of the electoral cycle.

As to defining elites, I would have been interested in the policy preferences of the top one or two percent, who are the real elites in my book. This exchange was enlightening:

Would you say the government is most responsive to income earners at the top 10 percent, the top 1 percent or the top 0.1 percent?

This is a great question and it’s not one we can answer with the data that we used in the study. Because we really don’t have good info about what the top 1 percent or 10 percent want or what issues they’re engaged with. As you can imagine, this is not really a group that’s eager to talk with researchers.

John Davidson drew to my attention this post by Matt Cowgill. Defining the elite by income is no simple matter.

First we have perceptions of income versus reality:

income-perceptions
Some 83% of people think they’re in the middle four deciles of the income distribution, whereas by definition only 40% can be. It seems most of us think we are middle class. The rich especially have little idea of how privileged they are.

Cowgill leads us through the complexities of analysing wage and income distribution. Of most interest was this table which takes into account household circumstances:

Household incomes_cropped

In terms of straight taxable income the top 10% cut in at about $105,000. If we are to do similar research to the Princeton study in Australia, I’d suggest targeting senior executives, I’m guessing in the range of $200,000 plus. They are likely to sit in the top 5% of incomes. They are also likely to reflect the views of the top 2% whose views Gilens found to be unknowable.

If government is to be accountable to the electors, then the Princeton research suggests that universal franchise is a necessary but not a sufficient condition for democracy. We need to think carefully about how democracy works, lest we be left with the form rather than the substance.

Hockey’s morality play

Joe Hockey has mightily offended Bernard Keane by making his austerity a moral issue, evoking a trenchant critique. The shorter Keane is that if you turn budgeting into a moral issue you are held to a higher standard. On this basis Hockey comes out as a prize hypocrite.

More of Keane later, first let’s wrangle some numbers.

I’ve made a table of the 15 major expenditure items identified by the National Commission of Audit as causing concern over the long term, omitting the eight years of 2015-16 to 2013-24 for convenience. The intervening data does tell some stories. For example, after growth spurts both Schools and the NDIS settle to much flatter growth in the out-years. The table was reprinted in the AFR.

Audit Report_cropped_600

To me the most important numbers are the two in the bottom right. When all is said and done total Commonwealth payments would grow by 0.2% of GDP over 10 years. In today’s dollars that’s about $3 billion dollars. Sounds a lot, but in a $400 billion budget it’s a rounding error.

Hockey is trying to achieve two main goals. (Here I’m drawing mainly from Phillip Coorey, but also Laura Tingle in the AFR.)

First, he is aiming at a small surplus in 2019-20 and a surplus of one per cent of GDP by 2023-24. Economists and others can argue about timing and quantum but this aim seems to me fair enough.

Secondly, Hockey wants to shrink expenditure as a proportion of GDP. This is ideological, not moral.

Hockey claims that if he takes his hands off the wheel expenditure will grow by 3.75% per annum, reaching 26.5% of GDP by 2023-4. From memory, I think that’s roughly where it was under Howard and Costello.

The CIA’s world Factbook has a country comparison of tax and other revenues as a proportion of GDP. Obviously they use a particular definition (probably includes GST) since Australia comes in at 33.2%. By contrast we have Canada at 37.7%, New Zealand at 38.5%, the UK at 40.4%, then follow the Europeans up to the Scandinavians at above 50%. If Australia’s share was lifted to Canada’s the government would have an extra $55 billion available.

All I’m saying here is that lifting the share by a few percentage points is not self-evidently a crime against the people, immoral or even economically foolish.

The audit commission has assumed that tax receipts must remain limited to 24% of GDP, for reasons unknown.

Before the election Hockey was saying that he would take 1% off tax receipts as a proportion of GDP. He hasn’t nominated a percentage now that I know of, but he has deemed that growth in expenditure will be limited to 1.75% per annum. That’s harsh. Tingle says Labor’s aim, not always achieved, was for a 2% limit, also austere.

Again we are told this 1.75% limit is right, responsible and moral, without any supporting argument.

Labor’s plans

Wayne Swan, I understand, reduced outlays by a couple of percentage points of GDP. His problem was that revenues were a couple of percentage points shy of outlays. Still, Labor had a long-term plan back to the black. The following graph is from the Pre-Election Fiscal Outlook (PEFO) published under the charter of budget honesty before the last election. I displayed it in my ‘liars and clunkheads’ post back then.

fcccad64-03b4-11e3-9d44-7643a0300d9c_chart1_580

I understand it involved allowing bracket creep. One has to ask why Hockey’s self-imposed austerity path is supposed to be superior.


Hewson on tax concessions

One way of fixing the budget would be to allow bracket creep, ruled out by the audit commission and Hockey.

Another way, suggested by John Hewson, would be to take a look at tax concessions, especially in superannuation.

A startling fact is that the percentage of retired folk receiving at least a part pension is projected to remain at 80%. Hewson says that superannuation policy robs the poor in favour of the rich, and in amounts that matter. He calculates super tax concessions at around $44 billion, roughly the same as the aged pension but growing faster.

Tax concessions overall are around $120 billion rising to $150 billion by 2016/17. Today’s AFR identifies some of the budget sacred cows, leading with $15 billion in protecting the family home from capital gains, $13 billion in not broadening the GST. Tightening the age pension means test to include the family home would save $7 billion.

By contrast the mooted ‘deficit levy’ would only yield hundreds of millions even if implemented widely. It’s small change. Such a move must be regarded a political rather than economic.

Keane’s critique

Keane asked Hockey what he was going to tell his granchildren about what he did to prevent global warming. They will pay.

Why were Labor’s efforts to reign in middle class welfare either not commented on or termed “class warfare” or “the politics of envy”?

Why did the LNP fight tooth an nail cutting back the private healthcare rebate to high-income earners?

In November, Hockey abandoned Labor’s plan to reduce the extravagant tax concessions enjoyed by superannuants earning over $100,000 a year, costing billions. He also restored a fringe benefits tax rort, an actual rort, for novated leases, again worth billions.

Hockey wants to cut carbon pricing and the mining tax.

Hockey is talking to us about the “moral imperative” of fiscal discipline while handing billions to large companies, wealthy retirees and tax rorters.

One minute Hockey is complaining about

a “massive increase” in defence spending beyond forward estimates and that it was a budget boobytrap, a fiscal “tsunami coming across the water” created by Labor.

The next minute he’s committing billions to F-35s which “wouldn’t cost anything” because it’s already in the budget.

Then of course there is the rolled gold parental leave scheme.

Keane reckons Hockey has cut revenue by about $15 billion. He would have increased spending by a similar amount. Then he complains about a budget mess and dresses up his austerity program as a moral crusade.

By the way here’s Labor’s Budget debt in context:

Debt_35d9ec68-d401-11e2-a269-28d841715c70_14p22bassRESIZED_cropped

I think we’ve been short of revenue since Rudd matched Howard’s tax cuts in the 2007 election campaign. There’s nothing broken about the budget that a steady hand, a mature review of priorities and a gradual return to revenue levels prevailing under the Howard government would not fix, together with a modernisation of the whole tax regime. Time to look seriously at Ken Henry’s review.

Elsewhere, Peter Martin has some tips.

Update:

In the Weekend AFR Phillip Coorey in an article The budget crunch is John Howard’s baby too reckons the budget problems date back that far. Apart from generous handouts to middle Australia in the previous years, Howard/Costello promised a $31.5 billion tax cuts in the May 2007 budget. One day into the election campaign he added a promise of $34 billions worth of further tax cuts (we’re talking four-year budget cycles). Rudd matched him, in addition to his own spending plans. The half-year budget update did find an extra $59 billion worth of revenue.

No-one foresaw the GFC and the end of the salad days.

Also Chris Bowen has an article pointing out that scrapping the low income superannuation contribution (LISC) and deferring the increase in the superannuation guarantee will take $55 billion out of our national savings pool over the next 7 years. These policies, he says, were designed to reduce the numbers of middle and low income earners requiring pension support in the future. Do this rather than lift the retirement age, he says.

Bowen’s comment received specific support from Tony Shepherd, chair of the audit commission.

See also John Davidson’s post, plus Richard Holden on why Australia does not have a debt crisis.

Update – posts on Budget 2014:

On a mission to upset everyone

Budget explainer

A crisis in trust

Shredding the fig leaf

Poll anger or a shift in the tectonic plates?

To GST or not to GST
Cap super, says Richard Denniss

Resolving the budget ‘crisis’

Hockey’s debt and deficit mess

Climate change, sustainability, plus sundry other stuff