Tag Archives: Temperature

Climate clippings 128

1. Hot and cold

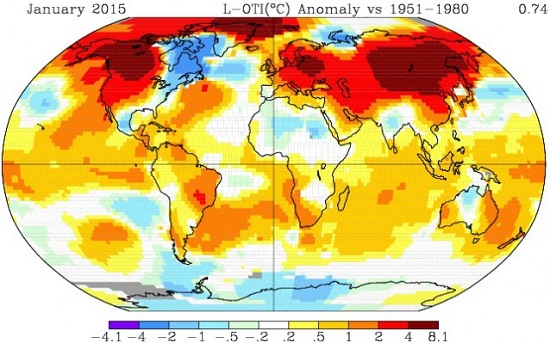
My sister in Toronto tells us how cold it has been. She can’t remember the last time it reached -5°C.

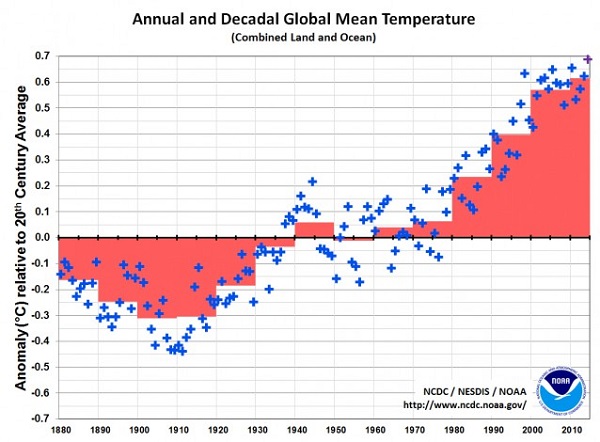
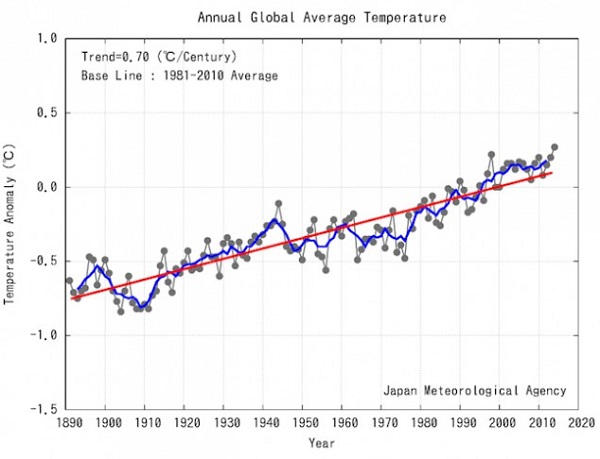
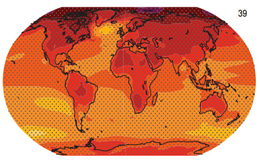
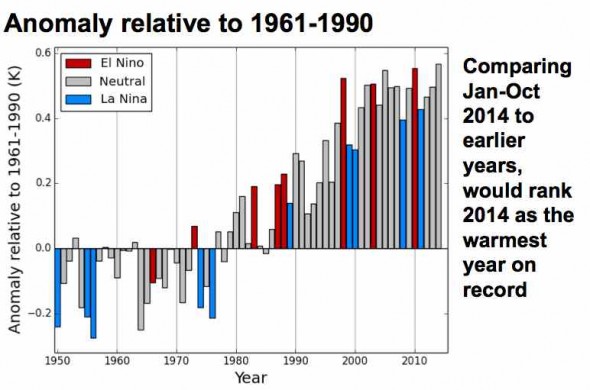
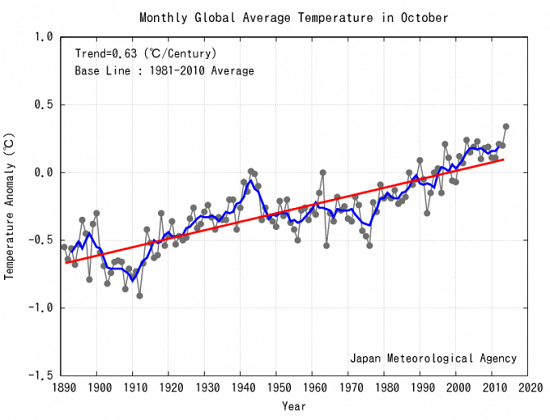
Yet NASA finds that Feb 2014 to Jan 2015 was the hottest 12 months on record. The picture tells the story:

NASA1-15-550

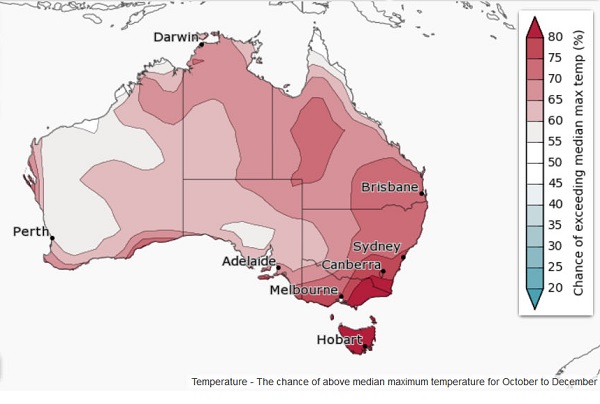
2. Record megadroughts predicted

The American Southwest and the great Plains could experience the worst megadroughts in ancient and modern times.

According to the findings, future droughts in both regions will be more severe than even the hottest, driest megadroughts of the 12th and 13th centuries, which are believed to have contributed to the fall of ancient Native American civilizations that inhabited the Southwest, such as the Pueblo Indians.

Climate Central gives the odds.

The chances of a megadrought (lasting 35 years or longer) are up to 50%.

The odds of a decade-long drought are around 90%.

There’s also a 5-10 percent chance that parts of the region could see a state of “permanent” megadrought lasting 50 years or longer under the highest-warming scenario, a greenhouse gas emissions path we’re currently on.

3. New era of climate action and hope

Christiana Figueres reckons 2015 is going to be a transformational year in climate change action. She of course is the boss-person of the United Nations Framework Convention on Climate Change (UNFCCC) which is sponsoring the Paris talks in December.

Amongst other things she mentions the June Live Earth concerts initiated by Al Gore and Kevin Wall (reviving their 2007 effort) to be held in New York, South Africa, Australia, China, Brazil and Paris.

She also plugs the UNFCCC’s Momentum for Change initiative, including Lighthouse Activities.

4. UK parties in pact on climate change

David Cameron, Nick Clegg and Ed Miliband have agreed to work together to tackle climate change, as they warned it posed a threat to national security and economic prosperity.

In what might be seen as a surprising move in the run-up to the general election, the three party leaders have pledged to work “across party lines” to agree cuts to the UK’s carbon emissions.

They have also signed up to seeking a “fair, strong, legally binding” international climate deal, set to be negotiated in Paris at the end of the year, to limit global temperature rises to below 2C – the level beyond which “dangerous” climate change is expected.

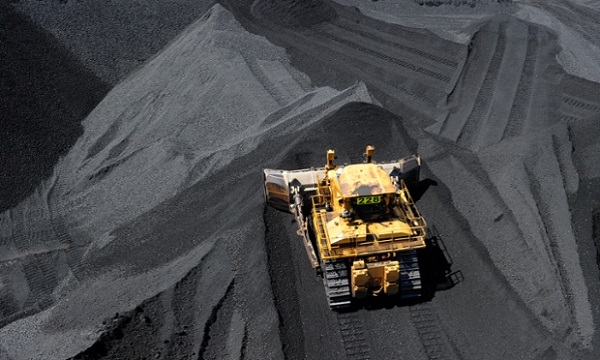
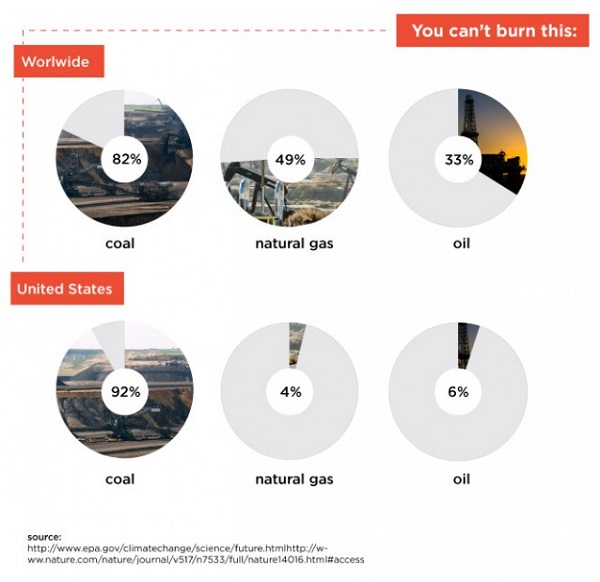
And they pledged to move to a low-carbon economy, ending the use of coal without technology to capture and store its emissions for power generation. (Emphasis added)

5. Tesla’s fancy home battery

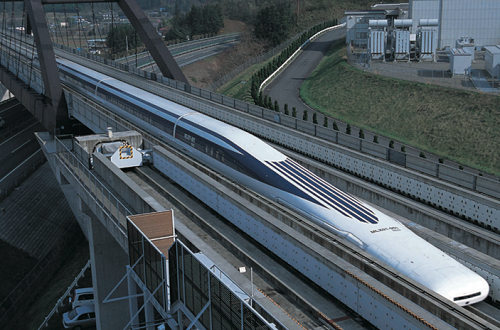
Tesla will start production in about six months, all going well.

“We are going to unveil the Tesla home battery, the consumer battery that would be for use in people’s houses or businesses fairly soon.”

“Some will be like the Model S pack: something flat, 5 inches off the wall, wall mounted, with a beautiful cover, an integrated bi-directional inverter, and plug and play.”

Thanks to Geoff Henderson who linked to this one recently at Saturday Salon. Yes, it could indeed be a game changer.

6. Laser ignition to replace spark plugs

A team at Princeton Optronics working on replacing conventional spark plugs with laser igniters has produced a running engine and they claim that replacing spark ignition with lasers could improve the efficiency of gasoline powered engines by 27%. Considering that the basic design of the spark plug hasn’t really changed in over a century, this would be a revolutionary step, frickin’ lasers or not.

Because the spark plug is located on the edge of the combustion chamber, not all of the fuel is combusted. Laser ignition can be directed to the centre of the chamber, or in fact to multiple parts of the chamber in extremely rapid succession. Ignition can also be more accurately timed in relation to the movement of the piston. The result is a more complete burn and greater fuel efficiency.

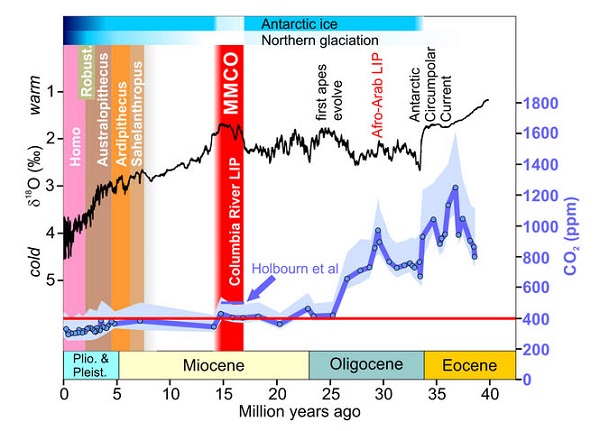
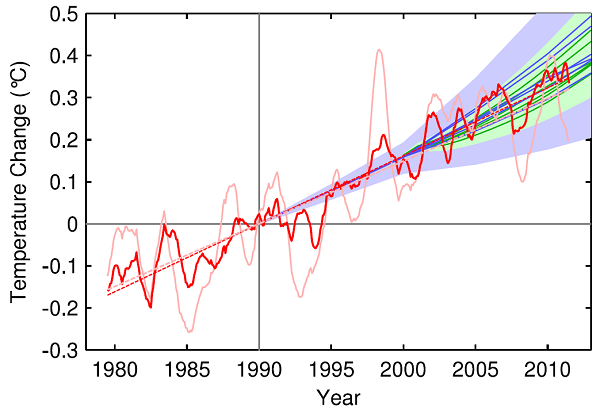
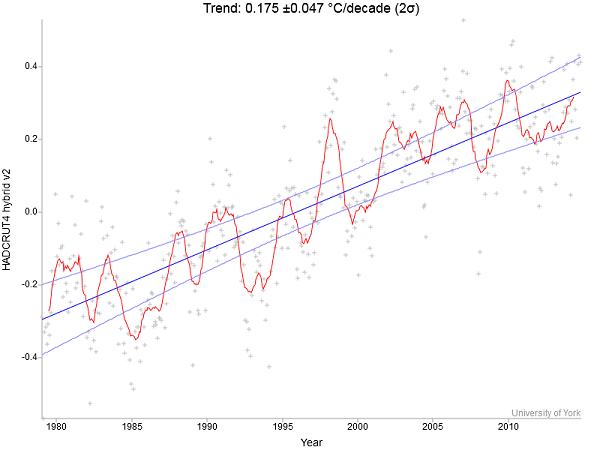
7. Climate oscillations and the global warming faux pause

Michael Mann posts on research he was conducted, with others, on multidecadal climate oscillations in the Pacific and the Atlantic Oceans. They found that the Pacific dominates and was the predominant cause of a slight slowing in predicted warming over the past decade-and-a-half or so.

It is possible that the downturn in the PMO [Pacific Multidecadal Oscillation] itself reflects a “dynamical response” of the climate to global warming. Indeed, I have suggested this possibility before. But the state-of-the-art climate model simulations analyzed in our current study suggest that this phenomenon is a manifestation of purely random, internal oscillations in the climate system.

This has implications for the future.

Given the pattern of past historical variation, this trend will likely reverse with internal variability, instead adding to anthropogenic warming in the coming decades.

The “false pause” may simply have been a cause for false complacency, when it comes to averting dangerous climate change.

Reminder Climate clippings is an open thread and can be used for exchanging news and views on climate.

Climate clippings 126

1. New research reveals extreme oxygen loss in oceans during past climate change

New research published this week reveals that vast stretches of the ocean interior abruptly lost oxygen during the transition out of the last ice age that occurred 17,000–10,000 years ago.

If that happened as a result of the relatively gentle forcing caused by changes in the Earth’s orbit, imagine what is possible now!

Like most of the life on the planet, the large majority of marine organisms need oxygen to live. Most marine life, from salmon, crabs, to shellfish, respires oxygen and many forms are intolerant of low oxygen seawater.

So-called ‘dead zones’ do contain life comprised of worms, bacteria, specialized urchins and bivalves, and other extremophiles, just not the kind of tucker we like to eat.

2. India ‘walking the talk’ on climate change

India is one country a bit allergic to discussing agriculture and climate pollution. They worry about feeding the millions. They also got a serve from Obama when he was there:

During a visit to New Delhi last month, Obama warned that the world does not “stand a chance against climate change” unless developing countries such as India reduce their dependence on fossil fuels.

India, as usual, is impervious to pressure, but the environment minister reckons they are doing their bit. New prime minister Narendra Modi is keen on renewable energy:

Since coming to power in May, Modi has pledged to increase India’s renewable energy in a bid to lower coal use and bring electricity to more than 300 million poor people currently without power.

Modi, who built up a solar industry in Gujarat state when he was chief minister, has set a target for India to have 100 gigawatts of solar capacity by 2022.

3. Abbott’s decline attributed to G20 Obama snub and climate change

On Newspoll Abbott’s net approval rating is now -44 (68% disapprove, 24% approve of how he is doing his job). Jason Wison says:

After a polling mini-recovery of sorts for Abbott between July and September, November – the month of the G20 and Obama’s address – marked a turning-point. Between September and November, Abbott’s always-poor net satisfaction ratings had improved and stabilised a little; from November they declined rapidly to where they are today. In some polls, Abbott now has more than half the voters saying that he should resign. November was also the month in which Bill Shorten decisively overcame Abbott as preferred prime minister, and Shorten’s lead is now wider than ever.

Wilson reminds us that Abbott refused to accept President Obama’s request to put climate change on the G20 agenda. Obama’s response was to kick off his stay with an address at the University of Queensland embarrassing Abbott with his references to Australia and climate change.

4. Maurice Newman wrongly claimed a UK charity had blamed the deaths of elderly people on renewable energy policies

Maurice Newman is of course Tony Abbott’s top science advisor. Graham Readfearn investigated his claim and found:

Newman is not only misrepresenting the charity’s position, he appears to be making up positions that the charity simply does not hold.

Also:

between 2004 and 2011 the average annual energy bill in the UK went up from £610 to £970.

Only £30 of that £360 increase was due to costs related to low-carbon power generation.

Most of the increase, the analysis said, was down to higher gas prices and network costs (maintaining poles and wires).

In my view, Newman’s attempt to pin the blame for the deaths of UK pensioners on renewable energy policies is either disgustingly dishonest or pathetically sloppy.

In the rest of the article Readfearn gives an explainer on how world surface temperature is measured.

5. Miocene temperatures

This Skeptical Science post gives a detailed account of what happened 14 to 17 million years ago in the “Mid Miocene Climate Optimum” (MMCO):

The MMCO was ushered in by CO2 levels jumping abruptly from around 400ppm to 500ppm, with global temperatures warming by about 4°C and sea levels rising about 40m (130 feet) as the Antarctic ice sheet declined substantially and suddenly.

Over the succeeding 2-3 million years Antarctic ice fluctuated dynamically in response to orbital wobbles, showing it was balanced on a knife-edge between a world with little ice and a world with substantial ice caps. Ice-free parts of Antarctica were rain-drenched and supported lush vegetation, while Arctic land was covered by temperate forests. Parts of the planet that had been arid before the MMCO rapidly re-greened and reforested (eg Patagonia).

This graph plots temperature and CO2:

Miocene_cropped_600

There were some differences between then and now. The Isthmus of Panama had not closed, for example. The warming happened on a warmer base.

Our warming is about 1000 times faster, giving less time for ecosystems to adapt. This is problematic for ocean acidification inter alia.

Climate clippings 125

1. Paris climate talks won’t keep warming below the dangerous 2°C Limit

Joe Romm at Climate Progress believes the Paris climate talks should not be written off as a failure if they don’t do enough to keep warming below 2°C. He thinks the CFC ozone layer example is apt. The Montreal Protocol was concluded in 1987. Initially the protocol’s targets and timetables slowed the rate of growth of concentrations only slightly and would have still led to millions of extra cases of skin cancer by mid-century.

President Reagan endorsed the protocol, and the Senate ratified it. By the end of 1988, 29 countries and the European Economic Community — but not China or India — had ratified it. The treaty came into effect the next year. But it took many more years of negotiations, continuous strengthening of the scientific consensus, and significant concessions to developing countries before amendments to the treaty were strong enough and had enough support from both rich and poor countries to ensure that CFC concentrations in the air would be reduced.

Elsewhere 14 high-profile CEOs want to decarbonise the economy completely by 2050. They are the B Team led by Virgin founder Richard Branson. See also at The Guardian.

2. 2013 record heatwave ‘virtually impossible’ without climate change

That’s according to a new report from the Climate Council.

From The Guardian:

The country experienced its hottest day, month, season and calendar year in 2013, registering a mean temperature 1.2C above the 1961-90 average.

The Climate Council says recent studies show those heat events would have occurred only once every 12,300 years without greenhouse gas emissions from human activities.

Record hot days have doubled in Australia over the past 50 years. During the past decade heat weather records were set three times more often than cold ones.

Heatwaves across Australia are becoming hotter, lasting longer, occurring more often and starting earlier.

The ABC article has handy links to other sites.

The following graph shows the number of days each year where the Australian area-averaged daily mean temperature was above the 99th percentile for the period 1910-2013:

Hot days Australia_cropped_600

3. Two degrees by 2036

Michael Mann using an Earth energy balance model has calculated that we could reach 2°C of warming as early as 2036. To stay within the 2°C guardrail we need to limit CO2 concentrations to 405 ppm. It would be 450 ppm but for the aerosol issue. If we cease burning coal we lose the cooling effect of the crap that coal spews into the atmosphere along with CO2.

Mann has done the calculation on the basis of climate sensitivity of 3°C. Problem is, he says, that this modelling is based only on short term feedbacks.

David Spratt at Climate Code Red has done a long and thorough post based on Mann’s article. Spratt looks in some detail at the longer term climate sensitivity issue, drawing also on the work of James Hansen, Aradhna Tripati and others. Hansen found that climate sensitivity with long term feedbacks was considerably higher than 3°C; Tripati found that in the Miocene with CO2 concentrations similar to now “temperatures were ~3° to 6°C warmer and sea level was 25 to 40 meters higher than at present”.

Spratt also reminds us that 2°C warming is not safe.

4. Would turfing Abbott help climate change policy?

In short, yes, but perhaps not a lot. The conservative side of politics is still infested with climate change denialists.

Mother Jones in an article One of the World’s Worst Climate Villains Could Soon Be Booted From Office would clearly like to see the back of Abbott. Julie Bishop has a background of denialism, but is pragmatic and has understood from the Lima experience that our stance on climate is negatively affecting our international standing.

Turnbull stated back in 2009:

“I will not lead a party that is not as committed to effective action on climate change as I am.”

He would now, of course.

Tristan Edis looks at actions Turnbull might get away with. Giles Parkinson thinks he might rescue renewable energy and could adapt Direct Action into a baseline and credit scheme.

See also Lenore Taylor at The Guardian.

Climate clippings 122

1. Court challenge will test coal mining’s climate culpability

A new legal challenge to the proposed Carmichael coal mine – Australia’s largest – will test in the federal court whether climate change caused by greenhouse gas emissions should be taken into account when assessing prospective coal licences in Australia.

The challenge, by the New South Wales Environmental Defenders Office on behalf of the Mackay Conservation Group, will argue that federal environment minister Greg Hunt failed to take into account the climate impact of greenhouse gases emitted by the burning of coal from the Carmichael mine when assessing whether to grant its licence.

It cites the impact of global warming on the Great Barrier reef, an area of world and national heritage, as a relevant consideration which the minister should have been taken into account.

The linked article cites some of the legal precedents, which show that this case is far from vexatious or frivolous.

Interesting!

2. Queensland Labor renews support for coal

0a0cf284-0505-4e4e-a7c3-4ec2c99d7884-600

Outgoing deputy Labor leader, Tim Mulherin, said coal remained “an important and vital energy source for Queensland and the rest of the world”.

Thermal coal from nine proposed projects in the Galilee, when burned in export markets such as China and India, would produce an estimated 705m tonnes of CO2, more than Australia’s total greenhouse gas emissions of 542m tonnes a year.

However, Labor in not going to spend hundreds of millions of dollars on building the railway line to the coast.

3. Humanity is in the existential danger zone

Back in 2009 a team lead by Johan Rockstrom of the Stockholm Resilience Centre identified nine planetary boundaries we should not cross if we are to avoid undermining the biophysical systems upon which our species depends. These nine boundaries are climate change, ocean acidification, stratospheric ozone depletion, alteration of nitrogen and phosphorus cycling, freshwater consumption, land use change, biodiversity loss, aerosol and chemical pollution.

A new paper led by Will Steffen of the ANU and the Stockholm Resilience Centre argues that climate change along with “biodiversity integrity” should be recognised as core elements of the Earth system. We are in trouble with both.

The world as we know it developed during the Holocene from which we are rapidly departing. We need urgently to get atmospheric concentrations of CO2 back to 350 ppm.

Background extinction rates without human impacts are thought to be about ten a year per million species.

Current extinction rates are anywhere between 100 to 1000 times higher than that.

4. Catholics in Australia join global movement to curb climate change

Australia’s Catholics are preparing to step up campaigns to address climate change ahead of an expected call to action by Pope Francis.

The Global Catholic Climate Movement, an international coalition of Catholic groups including Catholic Earthcare Australia, was launched on Thursday to bolster support for a global climate treaty at the Paris summit planned for December.

5. NOAA declares 2014 the hottest

NOAA has declared 2014 the hottest year to date with this graphic:

decadal-NOAA 2014-600

If you drew parallel trend lines from about 1970 it would be full bore ahead with 1998 a slight outlier.

At Climate Central we are told that 13 of hottest 15 years on record have all occurred since 2000. The odds of that happening randomly without the boost of global warming are 1 in 27 million.

6. Sea level rise

There’s been some excitement about a new study of sea level rise. The difficulty in establishing long term trends is that prior to the satellite era (1979, I think) it has been very difficult to establish what happened. Data is globally patchy and incomplete. Tide gauge measurements suffer because the wind blows the water around, and the land that it is referenced to might be rising or sinking.

The clearest account of the new research by Carling Hay and others I’ve found is at Carbon Brief. Hay et al found sea levels from 1900 to 1990 to be 1.2 mm pa on average, lower than the 1.5 previously thought. This makes current sea level rise some two and a half times faster, with the implication that ice sheets a contributing more than previously thought.

Over at RealClimate Stefan Rahmstorf gives a technical review of the state of play. He regards the new research as important, but his bottom line is this:

Ultimately, it is not clear down to what level of accuracy we will ever know the sea level evolution over the past hundred years or so. But for practical purposes, I don’t think it matters whether the rise from 1900 AD has been 3 centimetres more or less. I do not think this changes our outlook for future sea-level rise in any significant way.

But if I understand him correctly, he would already have been considerably concerned about the decay of ice sheets and how that process could accelerate. However, he strikes me as wanting to be super careful not to run ahead of the data, which is entirely commendable.

One comment was that this research could add a metre to prospective sea level rise this century. I think Rahmstorf is suggesting that is premature.

Climate clippings 121

1. Denmark winds up wind

In January of 2014, Denmark got just over 61% of its power from wind. For the whole of 2014 it was 39.1%, a world record.

Their leadership is working well for them. Nine out of ten offshore turbines installed globally are made in Denmark. They plan to be fossil fuel free by 2050.

Elsewhere Germany and the UK smash records for wind power generation. Scotland hopes to be fossil fuel free by 2050.

On Boxing day rooftop solar met one third of South Australia’s demand and at least 30% from 11.30am to 3.30pm. Bonaire (pop. 14,500), a small island off the coast of Venezuela, said goodbye diesel and hello 100% renewable electricity.

California Gov. Jerry Brown last week called for

the state’s electric utilities to boost their renewable energy procurements to 50% of retail electric sales and discussed future initiatives to support rooftop solar, battery storage, grid infrastructure and electric vehicles.

As Bill Lawry would say, “It’s all happening!”

2. 2014 the hottest year

The first set of figures is in, this time from the Japan Meteorological Agency, showing 2014 as the hottest year so far:

JMA2014-cropped_600

The red line is the long-term linear trend.

The blue line is the 5-year running mean.

Australia had the third hottest year on record.

3. Chinese three-wheeler is for real!

From John D’s Gizmag collection we have the Spira4u three-wheeler car:

spira-production-version-2_500

It’s not a toy, it’s a serious car which has gone into pilot production as a 10 kW electric or a fuel-injected 150 cc version with an economy of 2.94 l/100km (80 mpg).

It has a handy parking option:

spira-production-version-14_500

And it floats:

spira-production-version-11_500

An amphibious version is under development.

4. California starts to build a high-speed rail system

The first phase of California’s high-speed rail system will be a 29-mile stretch from Fresno slightly north to the town of Madera. From there the project will link up with urban centers like Los Angeles and San Francisco, eventually allowing commuters to travel between those two cities at 220 mph and cutting the trip from nearly six hours to less than three. The system will eventually extend to Sacramento and San Diego, totaling 800 miles with up to 24 stations.

The full rail system should be in use by 2028.

5. Solar at grid parity in most of world by 2017

At RenewEconomy:

Investment bank Deutsche Bank is predicting that solar systems will be at grid parity in up to 80 per cent of the global market within 2 years, and says the collapse in the oil price will do little to slow down the solar juggernaut.

Quiggin at The Conversation and his place: Only a mug punter would bet on carbon storage over renewables.

6. When you are in a hole, stop digging!

From a study in the journal Nature:

“Our results suggest that, globally, a third of oil reserves, half of gas reserves, and over 80 percent of current coal reserves should remain unused from 2010 to 2050 in order to meet the target of 2°C,” write authors Christophe McGlade and Paul Ekins of University College London.

stay-in-the-ground-cropped_600

Keeping the increase in global temperatures under 2°C will require vast amounts of fossil fuels to be kept in the ground, including 92 percent of U.S. coal, most of Canada’s tar sands, and all of the Arctic’s oil and gas…

In 2013, fossil fuel companies spent some $670bn on exploring for new oil and gas resources. The figure should be zero.

7. Climate change will create more environmental refugees

Natural disasters like Typhoon Haiyan—which devastated the Philippines in 2013 displace more people than war, according to the Internal Displacement Monitoring Center in Geneva. And as climate change sets off increasingly lethal natural disasters, so will the numbers of environmental refugees increase, Reuters reported.

It is a reality that governments must prepare themselves for. In 2013, some 22 million people were displaced by extreme natural disasters like typhoons, earthquakes and tsunamis, a number three times the number of those who were forced to migrate because of war, according to the IDMC.

Earlier this summer New Zealand accepted a family who cited climate change as the reason why they had to flee their homeland, thought to be the world’s first official environmental refugees.

Explaining the pause that wasn’t

4732500-3x2-220

We’ve only just seen that statistically there never was a recent ‘pause’ or ‘hiatus’ in warming when two articles show up explaining the pause that wasn’t. A key word here is statistically. No-one is suggesting that there may not be variations from time to time that do not breach the trend.

Also climatologists are always interested in understanding the physical mechanisms behind both short-term variability and longer term trends.

First, via Carbon Brief there has been a new study examining the impact of aerosols from volcanoes.

Virtually all research into the climate influence of volcanic aerosols has used satellite measurements of particulates in the upper atmosphere (the stratosphere). These satellite measurements only monitor the volcanic aerosol at heights of 15 km and above. The new paper by David Ridley and colleagues studied the amount of volcanic aerosols in portions of the stratosphere that lie below 15 km.

They found that 30 to 70% of aerosols from recent eruptions lodged below the 15 km mark. Further, these lower level aerosols had been responsible for significant cooling since 2000. Taken together with additional heat being stored in the deep oceans, the slowdown is “both fully accounted for and temporary.”

Estimated volcanic cooling from this source is not included in climate models.

A second study looks at the influence of Pacific winds on warming since the 1890s. They did this by analysing the chemical make-up of corals.

The coral record suggests, for example, that trade winds were weak between 1910 and 1940 when the Earth warmed by 0.4 degrees, and were strong from 1940 to 1970, during a period of relatively little increase in global temperatures.

Apparently the winds have been very strong since the turn of the century.

The winds in question are the trade winds that move tropical surface water from east to west. This two-dimensional image attempts to illustrate the complex pattern. Trade winds just north and south of the equator drive warm surface water westwards:

edu13-image_550x447

The water is replaced by cool water rising from the deep, which is known to affect global average surface temperatures. A simplified mechanism of how this works is given in the following:

thermocline

Knowledge of the influence of the wind on temperature variations is not new. For example, Matthew England of the University of NSW and others published a paper early in 2014 on the subject. England says of the new paper:

“This is a really important study: it confirms the crucial role of the Pacific Ocean in driving decadal climate variability at a global scale.”

The strength of the trade winds is associated with a natural climate phenomenon called the Interdecadal Pacific Oscillation (IPO). The IPO has positive and negative phases, which switch every few decades. Lead author Professor Diane Thompson says:

“We do know that the typical lifetime of a phase of this cycle is less than 30 years, and the current one began about 15 years ago. So although the timing of that switch remains difficult to anticipate, it would be most likely to happen within the next one to two decades.”

We don’t know the future of volcanic activity, nor when the Pacific wind pattern is going to switch. What we do know is that both have been inhibiting warming in recent years.

Of course Pacific wind patterns are also associated with ENSO where El Niño years are warmer and La Niña years are cooler. A year ago Stefan Rahmstorf looked at The global temperature jigsaw where he identified a variety of influences at work. It included a graph from a 2012 paper which used a multivariate correlation analysis to take out the influence of ENSO, volcanoes and solar activity. The pink line shows observed data and the red line with those three factors removed:

Rah2012_600

The ‘pause’ effectively goes away.

The observed data (pink line) in the above graph is an average of five data sets. It is likely that two of them, HadCRUT and NOAA omitted the Arctic entirely. I’ll post again the recent HadCRUT4 hybrid data from the satellite era which Rahmstorf suggests is now the best:

trend1_600

Again a pause is pretty hard to find, especially if you ignore 1998 as a outlier year. Of course 1998 should not be ignored as it appears to have had a crucial role in transferring stored heat from the ocean to the surface. It’s worth remembering just how little of the planet’s energy is stored on the surface compared to the ocean:

GW_Components_570

Rahmstorf did predict that when we had another El Niño year a new record would be set. 2014-15 is not an El Niño, not yet, but is being heralded as the warmest ever. I’ll wait for it to actually happen before reporting on it further. Meanwhile it’s a fair bet that we will have strong warming in the next few decades.

The end of the warming pause that wasn’t

The bottom line is that statistically there never was a recent ‘pause’ or ‘hiatus’ in warming. If you ever thought there was you’d have plenty of company, but 2014 sees temperatures returning to the trend line.

At RealClimate Stefan Rahmstorf took a look at global surface temperatures since the satellite record in 1979. He used Kevin Cowtan’s interactive temperature plotting and trend calculation tool and HadCRUT4 hybrid data, which now has the most sophisticated method to fill data gaps in the Arctic with the help of satellites. This is what he found:

trend1_600

Rahmstorf then looks at some shorter intervals using more recent starting dates. He finds:

There simply has been no statistically significant slowdown, let alone a “pause”.

He then displays an analysis done for Realclimate by Niamh Cahill of the School of Mathematical Sciences, University College Dublin using a technique called change point analysis. This time GISTEMP data from NASA GISS is used from 1880 to the present. 2014 was represented by January to October data, the latest available.

The algorithm used sorts through the data looking for changes in the trend lines, which it finds automatically. This is how it came out:

TempCP3_600

Change points were found approximately at 1912, 1940 and 1970. The trend since 1970 is firmly in place.

Tamino at Open Mind took a look at the same data. People often cherry pick a starting date so using a different statistical technique he examined whether there had been any change in trend starting from any year between 1990 and 2008. Often people choose a data set that suits their argument so he ran the technique over all eight commonly available data sets.

He could find no trend change – not even close.

I repeat: not only is there a lack of valid evidence of a slowdown, it’s nowhere near even remotely being close. And that goes for each and every one of the 8 data sets tested.

He then plots the GISTEMP data from 1970:

giss2_600

It’s all happening between the trend lines. Of course there are fluctuations, but none of significance. Not yet.

For a time the Hadley data simply left out the Arctic area where there are no weather stations. Of course the Arctic is warming faster than lower latitudes and it came to a point where this mattered. Recently they’ve corrected this by using satellite data, not directly, as the satellites measure the troposphere rather than the surface. I gather the satellite data is used comparatively to infer the surface temperature across the Arctic.

Looking back over the archive, there was a study by Cowtan and Way (see RealClimate and Climate clippings 89, Item 4) which compared the HadCRUT4 data of that time with ‘filled in’ data. This is how it looks:

Cowtan-600

Notice how the heavier corrected lines make 1998 a little cooler and recent peaks a little warmer.

Even so, I recall that Ross Garnaut in preparing his report about five years ago asked two leading statisticians to examine the trends. They said the long term warming trend was still in place. Seems they were right.

Two degrees

Carbon Brief has compiled a series of three posts on the so-called 2°C ‘guardrail’ used in global warming discourse:

This post will pick out some of the highlights, but is not a substitute for reading the posts. Continue reading Two degrees

Climate clippings 116

1. Super high speed rail

train_japan_maglev_500

The Japanese have run an actual train with people in it at 500 km/h. The Chinese have built a train which can theoretically run at 1800 mph by encasing it in a vacuum tube.

It looks as though high speed rail could become a real alternative to air for intercity travel.

Thanks to John D for the headsup.

2. World’s first power-to-liquids production plant opens

The world’s first power-to-liquids (PtL) demonstration production plant was opened in Dresden on 14 November. The new rig uses PtL technology to transform water and CO2 to high-purity synthetic fuels (petrol, diesel, kerosene) with the aid of renewable electricity.

The article does not say how efficient the process is, but presumably less so than using the electricity directly.

3. World Bank focus on clean energy

The World Bank has traditionally been one of the world’s largest funders of fossil fuel projects. Now it:

will invest heavily in clean energy and only fund coal projects in “circumstances of extreme need”…

No doubt this policy stems from the bank’s commissioned report Turning down the heat.

4. Why the Peru climate summit matters

Hope has been injected into the Climate Change Conference in Lima, Peru, scheduled to run from 1 to 12 December by the recent US/China agreement. The optimism stems as much from the fact that the two largest emitters in the world are finally working together as the level of ambition. The EU has also recently pledged to cut emissions by 40 percent from 1990 levels by 2030.

Countries will be working on the text of the draft agreement for Paris in 2015.

Countries are expected to put forward their contributions towards the 2015 agreement in the form of Intended Nationally Determined Contributions (INDCs) by the end of March [2015]. These will then be used to craft the Paris treaty. The Lima gathering will help provide guidelines and clarity for what these INDCs must entail, especially for developing countries still reliant on fossil fuels to meet fast-growing energy demand needed to achieve developmental goals. These options could range from sector-wide emissions cuts to energy intensity goals to renewable energy targets.

We’ll be represented during the second week by Julie Bishop and Andrew Robb, a climate change denier. Seems Bishop went bananas when she found out, and Robb doesn’t want to be there anyway.

Giles Parkinson reports that we’ve sent a delegation of 14, the smallest in 20 years and probably not enough to be actively obstructive as we were in Warsaw last year.

5. 2014 looks like hottest on record

This is how it’s shaping:

wmo-years-590x390

Record hot years are often El Niño years. This year is a neutral ENSO year so far.

That’s so far; there is at least a 70% chance that El Niño will be declared in the coming months, according to the BOM. Looks like a hot, dry summer.

6. Germany’s largest utility gets out of the fossil fuel business

On Sunday, Germany’s biggest utility E.ON announced plans to split into two companies and focus on renewables in a major shift that could be an indicator of broader changes to come across the utility sector. E.ON will spin off its nuclear, oil, coal, and gas operations in an effort to confront a drastically altered energy market, especially under the pressure of Germany’s Energiewende — the country’s move away from nuclear to renewables. The company told shareholders that it will place “a particular emphasis on expanding its wind business in Europe and in other selected target markets,” and that it will also “strengthen its solar business.”

E.ON will also focus on smart grids and distributed generation in an effort to improve energy efficiency and increase customer engagement and opportunity.

“With its decision, E.ON is the first company to take the necessary steps from the completely changed world of energy supply,” German Economy Minister Sigmar Gabriel, said Monday.

7. The inconvenient truth of EU emissions

The Commission and European Environment Agency’s Progress Report on climate action says:

according to latest estimates, EU greenhouse gas emissions in 2013 fell by 1.8% compared to 2012 and reached the lowest levels since 1990. So not only is the EU well on track to reach the 2020 target, it is also well on track to overachieve it.

Kevin Anderson is not impressed:

The consumption-based emissions (i.e. where emissions associated with imports and exports are considered) of the EU 28 were 2% higher in 2008 than in 1990[1]. By 2013 emissions had marginally reduced to 4% lower than 1990 – but not as a consequence of judicious climate change strategies, but rather the financial fallout of the bankers’ reckless greed – egged on by complicit governments and pliant regulation.

Then he really gets stuck in:

In the quarter of a century since the first IPCC report we have achieved nothing of any significant merit relative to the scale of the climate challenge. All we have to show for our ongoing oratory is a burgeoning industry of bureaucrats, well meaning NGOs, academics and naysayers who collectively have overseen a 60+% rise in global emissions.

The folly of two degrees

Back in 2011 David Spratt took a look at where we were in relation to temperature rise and the Holocene. At 2000 we were at 0.7°C above the pre-industrial temperature. This happens to coincide with the Holocene maximum:

Holocene_thin-blue-line 600

Spratt says James Hansen warns that at 0.7°C the ice sheets start to become unstable, so in terms of sea level rise alone we are entering a danger zone. Since then the temperature has risen ~ 0.15°C.

From this point of view the 2°C guardrail looks hazardous in the extreme. Continue reading The folly of two degrees

Climate clippings 114

1. Ocean acidification charted

Apparently there has been no baseline data for ocean acidification, which varies around the world. Now a database of the current state of the ocean has been compiled. Here is a map showing the rough state of play:

11_18_14_Brian_OceanAcidificationBaseline_400_462_s_c1_c_c

The current rate of acidification for the ocean is the greatest seen in the past 300 million years. 25% of co2 emitted ends up in the ocean.

This article offers some hope that some species may adapt.

2. Warmest October

NASA has October as the warmest since 1880 along with 2005. The Japanese Meteorological Agency has it as the warmest ever:

11_14_14_Brian_JMAOctTemp_679_519_s_c1_c_c_550

No warming pause there!

So far an El Niño still has not developed, which would make things warmer.

3. Climate Council report fingers us

The Climate Council has published a new report Lagging Behind: Australia and the Global Response to Climate Change. The key findings are:

  • China and the US have firmly moved from laggards to global leaders on climate change.
  • In the last five years most countries around the world have accelerated action on climate change as the consequences have become more and more clear.
  • Australia, a crucial player in global climate action, moves from leader to laggard.
  • Global action must accelerate to protect Australia and the world from the consequences of a changing climate, sea level rise and more frequent and intense extreme weather.

Now, 39 countries and over 20 sub-national jurisdictions are putting a price on carbon. China has the world’s second largest carbon market with 250 million people covered. In the US 10 states have carbon markets, covering 79 million people.

Germany has decoupled growth from carbon pollution. Since 1990 GDP has increased 37% while emissions have fallen 25%.

According to the IEA and the OECD for every $1 spent to support renewable energy, another $6 is spent on fossil fuel subsidies, but investment in renewable energy at US$192 billion now exceeds that in fossil fuel energy at US$102 billion.

Australia is the 15th largest emitter out of 186 countries. We emit roughly the same as France, Italy and Turkey, each with three times the population.

Here’s the world wide solar growth:

Solar_cropped_600

Our record on large scale renewables:

Aust renewables_cropped 600

Time to get on our bike!

4. Climate Council on renewables

The Climate Council report finds that around the world important initiatives on renewables are often taken at the sub-national level. In Australia:

  • South Australia is striding forward leading the Australian States on renewable energy.
  • Victoria and NSW have moved from leaders to laggards in Australia’s renewable energy race.
  • Australia has substantial opportunities for renewable energy. A lack of clear federal policy has led to a drop in renewable energy investment.

Only SA and the ACT have renewable energy targets – SA 50% of electricity by 2025, the ACT 90% by 2020. The current state of play is:

Renewable energy generation_cropped_500

SA narrowly pips QLD in terms of percentage of dwellings with solar PV:

Solar PV_cropped_600

Both have roughly a quarter.

The potential for renewables in Australia is huge – some 500 times current electricity generation.

Australia produces per capita 23.96 tCO2e as against an OECD average of 12.47. As I said, time to get on our bike!

5. China caps coal use by 2020

From Climate Progress

The Chinese government announced Wednesday it would cap coal use by 2020. The Chinese State Council, or cabinet, said the peak would be 4.2 billion tonnes, a one-sixth increase over current consumption.

This is a staggering reversal of Chinese energy policy, which for two decades has been centered around building a coal plant or more a week. Now they’ll be building the equivalent in carbon-free power every week for decades, while the construction rate of new coal plants decelerates like a crash-test dummy.

The 2020 coal peak utterly refutes the GOP claim that China’s recent climate pledge “requires the Chinese to do nothing at all for 16 years.” Indeed, independent analyses make clear a 2020 coal peak announcement was the inevitable outcome of China’s game-changing climate deal deal with the U.S. last week, where China agreed to peak its total carbon pollution emissions in 2030 — or earlier.

6. Australia a pariah

Giles Parkinson thinks other nations are deliberately trying to embarrass Australia on climate change. Certainly Obama’s remarks can be interpreted that way. Then he (Giles) really gets stuck in:

We are, quite possibly, witnessing the most incompetent and ideologically blind government ever to hold power in Canberra. It’s effectively the Tea Party of Australia, pretending to be something else.

Climate clippings 109

1. Home solar power plus battery storage

It’s on the way, according to reports in Climate Progress and RenewEconomy. They are reporting on reports emerging from HBSC, Citigroup and UBS, so the big end of town is taking notice.

Initial interest is in short storage to cater for the peaks, but it seems that full storage systems will become competitive before the end of the decade.

For the next ten years battery technology is likely to remain lithium ion, with newer technologies introduced later.

2. Oceans warming faster than thought

The top 700 metres of the ocean have been warming 24 to 55% faster since 1970 than previously thought. The problem has been poor sampling in the Southern Ocean.

Of course this means that the whole planet has been warming faster than previously thought, since over 90% of the extra heat goes into the ocean.

3. Human hands caused 2013 heat

To me 2013 seems like a long time ago, but it is remembered for breaking a lot of heat records in Australia.

January 7 was our hottest day on record – 40.3°C.

January was the hottest month on record.

The 2012-13 summer was the hottest on record.

September was the hottest on record, exceeding the previous record by more than a degree; this was the largest temperature anomaly for any month yet recorded.

September-November was the hottest on record.

The whole year of 2013 was the hottest on record.

Five studies have now been done establishing human agency in these events. We don’t just need to be concerned about our grandchildren. Climate change caused by humans is happening now.

4. NOAA explains record Antarctic sea ice growth

First of all the record does not represent a dramatic increase on the recent average:

AntarcticSeaIceHistory_600

By comparison the loss of land ice has tripled in the last five years alone.

NOAA have now given a more detailed explanation of how the increase, counterintuitively, may be related to global warming. Firstly, it’s the wind:

NOAA first points out that “much of this year’s sea ice growth occurred late in the winter season, and weather records indicate that strong southerly winds blew over the Weddell Sea in mid-September 2014.”

Secondly, the melting land ice itself may have an effect:

Most of Antarctica’s ice lies in the ice sheets that cover the continent, and in recent decades, that ice has been melting. Along the coastline, ice shelves float on the ocean surface, and much of the recent melt may be driven by warm water from the deep ocean rising and making contact with ice shelf undersides.

How does the melting of land ice matter to sea ice formation? The resulting meltwater is fresher than the seawater. As it mixes with the seawater, the meltwater makes the nearby seawater slightly less dense, and slightly closer to the freezing point than the ocean water below. This less dense seawater spreads out across the ocean surface surrounding the continent, forming a stable pool of surface water that is close to the freezing point, and close to the ice onto which it could freeze.

5. Marshall Islands expendable

The United Nations chose 26-year-old Marshall Islands poet and mother Kathy Jetnil-Kijiner to be among the keynote speakers at the UN’s climate summit in New York recently. Here she is at the mike with her husband and child:

AP5150773745-500

Marshall Islands sits on average about 2 metres above sea level. Already she’s seen waves crashing into their homes and their breadfruit trees wither from salt and droughts.

Jetnil-Kijiner was confident in her speech that, no matter how difficult, climate change would be solved, and her daughter would be able to go on living in the Marshall Islands.

“No one’s drowning, baby,” she said. “No one’s moving. No one’s losing their homeland. No one’s becoming a climate change refugee…We are drawing the line here.”

She said, accurately I think, that saving the Marshall Islands meant “ending carbon pollution within my lifetime.”

Some 125 world leaders were present. Some, like ours stayed away, having more important things to do. Anyone present with half a brain must have known that is not going to happen. The Marshall Islands is expendable.

6. Climate outlook, October to December

In brief, warmer and drier than average, apart from Tasmania, which looks good for rain. There’s more detail and maps here.

This is what the rainfall prospect looks like:

Oct-Dec 2014_cropped_600

And maximum temperature:

Temp Oct-Dec 2014_cropped_600

Six of eight international climate models suggest a late season El Niño, or near El Niño, ENSO state is likely.