Category Archives: Climate Change & Sustainability

Posts on aspects of climate science, climate action and climate policy & planning.

Climate clippings 134

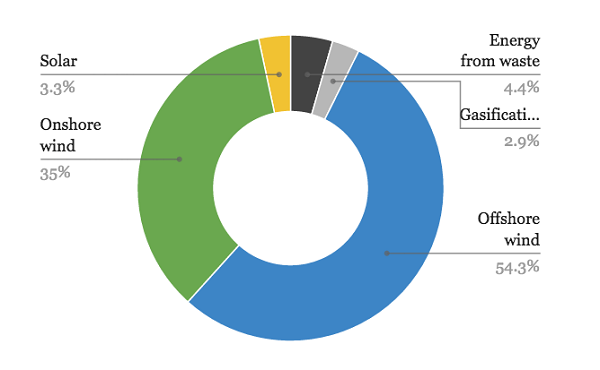
1. Abbott’s energy white paper focuses on fossil fuel favourites

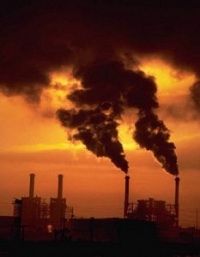
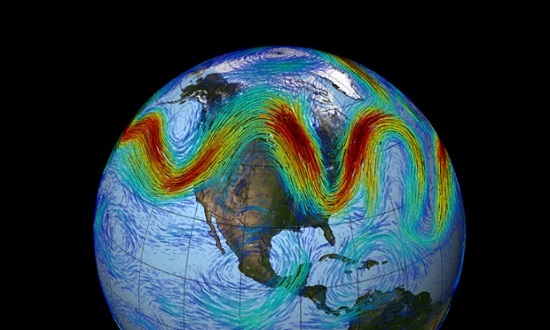
We should take a longer look at the Abbott government’s energy white paper, but from what Giles Parkinson says it would be a waste of time. As expected it ignores climate change and sees our future based on fossil fuels. Here’s Tones peering into our energy future:

Head_in_Sand_500

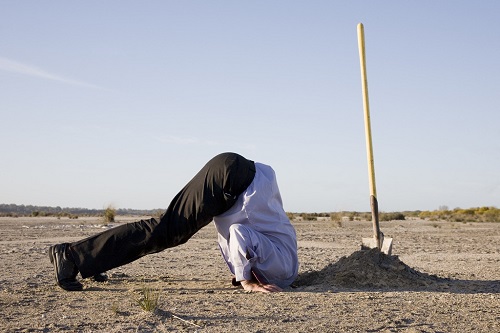
The world will pass him by!

2. Solar news

RenewEconomy was a flood of articles about solar.

Sophie Vorrath:

A company based in the world’s largest oil exporting nation, Saudi Arabia, has become the new owner of Australia’s second-largest solar plant – the under-construction 72MW Moree PV project – after buying Spanish solar developer Fotowatio Renewable Ventures (FRV) and its 3.8GW global development pipeline.

Abdul Latif Jameel Energy and Environmental Services – a conglomerate that also has a base in the United Arab Emirates – announced its purchase of FRV on Wednesday, describing it as a major development of its energy business, and part of its on-going strategy to be the Gulf’s largest solar power plant developer.

Giles Parkinson says the prospects for big solar in WA are bright.

James Mandel and Leia Guccione take a look at a Rocky Mountain Institute report that analyzes how grid-connected solar-plus-battery systems will become cost competitive with traditional retail electric service and why it matters to financiers, regulators, utilities, and other electricity system stakeholders.

Paul McArdle reports on the benefits of tracking systems in solar PV from a seminar hosted by the UQ Energy Initiative and the Global Change Institute.

And more, as the Abbottistas fade into irrelevance, except that they are presently running (ruining?) the country.

3. Aluminium battery charges in one minute

US scientists say they have invented a cheap, long-lasting and flexible battery made of aluminium for use in smartphones that can be charged in as little as one minute.

The researchers, who detailed their discovery in the journal Nature, said the new aluminium-ion battery had the potential to replace lithium-ion batteries, used in millions of laptops and mobile phones.

Besides recharging much faster, the new aluminium battery is safer than existing lithium-ion batteries, which occasionally burst into flames, they added.

While lithium-ion batteries last about 1,000 cycles, the new aluminium battery was able to continue after more than 7,500 cycles without loss of capacity. It also can be bent or folded.

Larger aluminium batteries could also be used to store renewable energy on the electrical grid, Professor Dai said.

Meanwhile the US market for energy storage management systems, that is the software suites designed to increase the operating efficiency and overall value of energy storage, will grow tenfold between 2014 and 2019.

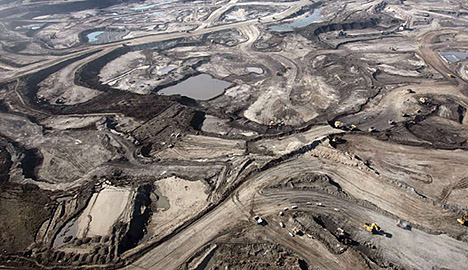
5. French banks rule out funding Galilee basin coal project

France’s three biggest banks have ruled out funding the controversial multi-billion dollar Galilee basin coal mining, rail and port development in Queensland. Eleven major international lenders have now publically stated that they won’t finance the $16.5 billion dollar project and one analyst says more delays could see the Indian company behind the project ultimately scrap the development.

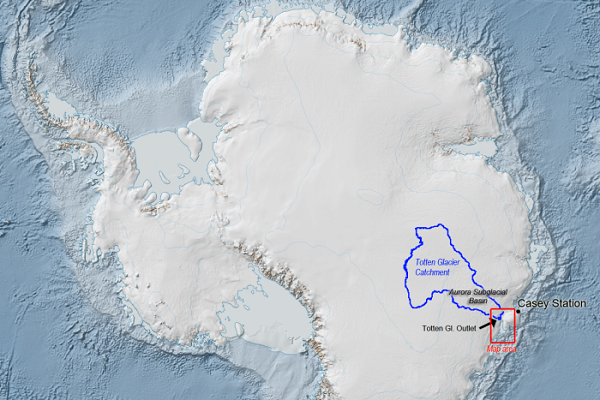
6. Rising sea levels to force the largest exodus in history

Scientists calculate that within the next three decades a substantial area along the Bay of Bengal, a region of delta approximately 200 delta islands in India and Bangladesh called the Sundarbans, will be underwater due to climate change and rising sea levels. If that happens, the millions of people living there now will be forced to abandon their homes and lands, making their displacement the largest exodus in modern history.

Estimates predict that the region will be underwater within the next 10-25 years, forcing 8 million Bangladeshis and 5 million Indians inland.

That makes 13 million displaced. Other large movements cited include 10 million during the 1947 India-Pakistan partition and 7 million African Americans move from the southern states northward during the period 1916-1970. The one he missed was the movement of Germans from Eastern Europe towards the end and after World War II. Tony Judt reckons 13 million.

7. Contrarian climate scientists

Dana Nuccitelli reviews an interview with top contrarian climate scientists Roy Spencer and John Christy. You can read his analysis of their flawed thinking and erratic statements. I’d like to pull out three points.

First, John Cook et al’s survey that established the 97% consensus in the peer-reviewed literature on human-caused global warming does not categorise the 3% as complete denialists. The 3% includes papers by scientists, such as Spencer and Christy, who minimise human influence on global warming. Complete denialists amongst climate scientists are rare if they exist at all.

Second, the American Meteorological Society (AMS) and Yale University conducted a survey of meteorologists in relation to climate science and global warming. Only 13 percent of survey participants described climate as their field of expertise. I was surprised at how low the number is.

Third, on the cost of renewables:

Experts in these fields who have published research on the subject have found that fossil fuels are incredibly expensive, when we account for all of their costs. For example, one recent study conservatively estimated that including pollution costs, coal is about 4 times more expensive than wind and 3 times more expensive than solar energy in the USA today.

Global temperatures may be about to jump

Joe Romm at Climate Progress comments on recent research that suggests a significant increase in global temperatures may be imminent.

‘Significant’ here means two- or three-tenths-of-a-degree Celsius, which compares to the 0.16°C/decade average seen in this graph from NASA:

NASAwarmingTrend-cropped_600

Clearly in this graph there was a jump in the temperature around 1998, then a period of consolidation of near record temperatures or small increases in the temperature. All the years from 2001 on were hotter than 1997.

Kevin Trenberth explains that most of the additional warmth (over 90%) goes into the ocean and global increases tend to happen towards the end of an El Niño event, while La Niñas tend to be cooler. This pattern of El Niños and La Niñas (ENSO) which last 6 to 18 months is superimposed on the pattern of PDOs (Pacific Decadal Oscillations) which can last a decade or more. The importance of the PDO was outlined in the post Explaining the pause that wasn’t last December.

The pattern of PDOs is shown in this graph:

Pacific-Decadal-Oscillation-3-15_600

The 1998 jump came with the super El Niño in 1998 at the end of an extended period of positive PDO, from 1992 and 1998. Now we are entering an El Niño at a time when the PDO has turned strongly positive.

Romm interviewed Kevin Trenberth:

I interviewed Trenberth this week, and he told me that he thinks “a jump is imminent.” When I asked whether he considers that “likely,” he answered, “I am going to say yes. Somewhat cautiously because this is sticking my neck out.”

What is not said here is that the current El Niño is a weak one and may not have much effect on the weather. Trenberth thinks the PDO has the greater effect, which is then modulated by ENSO. Given the shape of the PDO over the last 15 years, the current El Niño might be like pulling the cork on a bottle of fizz.

Climate clippings 133

1. Mt Everest’s poo problem

Every year climbers of Mt Everest leave behind 26,500 pounds of poo. I make that about 12 tonnes.

Sherpas pick it up, bring it down in blue barrels, dig a hole and dump it. Now the proposal is to build an anaerobic digester in a small village near Everest’s base to create biogas to produce power. Apparently human poo is not the best, but it works.

2. Arctic sea ice record

I think it’s time to call it. The Arctic sea ice winter maximum is the lowest on record. This graph shows 2015 ice against the previous record of 2011 and the 1981-2010 average:

sea ice_Feb 25_cropped_600

Also the maximum extent was reached on February 25, the second earliest on record.

According to a recent survey, thinning has been quite dramatic:

… annual mean ice thickness has decreased from 3.59 meters [11.8 feet] in 1975 to 1.25 m [4.1 feet] in 2012, a 65% reduction. This is nearly double the 36% decline reported by an earlier study….

In September the mean ice thickness has declined from 3.01 to 0.44 m [from 9.9 to 1.4 feet!], an 85 % decline.

Climate Central has a graphic showing the loss of ‘old’ ice. In 1987 it used to be 26% of the ice pack, now it’s down to 10%.

Polar bears will struggle to adapt.

3. Shell looks to drill in Arctic

Shell hopes to drill in the Chukchi Sea in the Arctic this summer. It looks as though Obama’s Department of the Interior will allow it, even though an Environmental Impact Report released by the Bureau of Ocean Energy Management (BOEM) noted a 75% chance of one or more large spills occurring under the current plan. In 1989 the Exxon Valdez disaster spilled nearly 11 million gallons of crude oil into the Alaskan Gulf, polluting over 1300 miles of coastline. It is estimated that only 14% of the oil was cleaned up.

By comparison BP’s Deepwater Horizon oil rig spilled 168 million gallons of oil into the Gulf of Mexico off the Louisiana coast.

Yet Obama himself stresses the need to move early on climate change. More than half of Republican politicians deny or question the science. Voter pressue will change that eventually.

A recent Stanford University poll found that two-thirds of voters were more likely to vote for a candidate that campaigned on a platform of fighting climate change, and were less likely to vote for a candidate that outright denies climate change.

4. Land, ocean carbon sinks are weakening

We are destroying nature’s ability to help us stave off catastrophic climate change. That’s the bombshell conclusion of an under-reported 2014 study, “The declining uptake rate of atmospheric CO2 by land and ocean sinks,”…

Based on actual observations and measurements, the world’s top carbon-cycle experts have determined that the land and ocean are becoming steadily less effective at removing excess carbon dioxide from the atmosphere. This makes it more urgent for us to start cutting carbon pollution ASAP, since it will become progressively harder and harder for us to do so effectively in the coming decades.

Joe Romm calls the study “one of the most consequential recent findings by climatologists”

More than half of emissions are currently absorbed by land and ocean-based carbon sinks. Increasingly these emissions will stay in the air.

5. Reasons the Australian solar market is so interesting

Clean Technica has found 7 reasons the Australian solar market is so interesting republished at RenewEconomy.

One reason is that we have so much sunlight, as shown below:

solar-australia

However, most of us live in the more cloudy parts in big cities and along the south-east edge. A commenter pointed out that for insolation Ney York lies between Melbourne and Sydney.

A second reason is that we are enthusiastic about roof-top solar, with over 20% of houses now with panels installed.

A third is that, along with Germany, Italy and The Netherlands, we reached socket (aka grid) parity in 2013.

Emissions reduction the Abbott way

The Abbott government’s just-released discussion paper on emissions reductions makes no mention of the global goal to limit warming to 2°C. In fact it appears to aspire to a world where 3.6°C is acceptable.

Comment includes Giles Parkinson at RenewEconomy and Lenore Taylor at The Guardian.

The Government is reviewing it’s post-2020 emissions targets in the context of negotiations for a new global climate agreement to be concluded at the United Nations Framework Convention on Climate Change (UNFCCC) Conference of the Parties in Paris in late 2015 (30 November to 11 December). The paper calls for submissions by 24 April as to what our target should be, how it should be expressed, what the impact on Australia would be, and

“which further policies complementary to the Australian Government’s direct action approach should be considered to achieve Australia’s post-2020 target and why?”

The paper says that Australia’s target should be fair, ambitious, easy to understand and transparent. Also Australia’s target will be, it says, “consistent with continued strong economic growth, jobs growth and development in Australia.”

From The Guardian:

many observers are deeply alarmed that the discussion paper does not mention the 2C goal, but does mention a scenario that could result in almost 4C global warming.

Discussing Australia’s special “national circumstances”, the discussion paper says that “for the foreseeable future, Australia will continue to be a major supplier of crucial energy and raw materials to the rest of the world, especially Asian countries. At present, around 80% of the world’s primary energy needs are met through carbon-based fuels. By 2040, it is estimated that 74% will still be met by carbon-based sources because of growing demand in emerging economies.”

That scenario derives from the IEA world energy outlook 2014 whose “new policies scenario” was based on targets then adopted. The world has now moved on. RenewEconomy gives this table which reflects some of the recent targets announced:

CCA-targets-1_600

The Conversation has an interactive map to monitor countries’ contributions as they come in.

The discussion paper notes that Australia’s population is growing much faster than comparable countries, and that we have an economy more heavily dependent on coal. This sounds like a set-up for special pleading. The Climate Change Authority thoroughly examined our circumstances last year and argued for a reduction trajectory range of between 40 and 60% below 2000 levels by 2030.

Parkinson advises that the paper was prepared in the PM’s office, not the environment department, or the foreign affairs department which has carriage over international climate talks. Obviously the subject is too important to leave to people who know or care.

Climate clippings 132

1. Accelerating ice loss from Antarctica shelves

Some ice shelves in Antarctica are thickening and some are thinning. The pattern between east and west is obvious from this image:

ice shelves_image-20150326-8713-1fyzwcb_600

When we sum up losses around Antarctica, we find that the change in volume of all the ice shelves was almost zero in the first decade of our record (1994-2003) but, on average, over 300 cubic kilometers per year were lost between 2003 and 2012.

According to the ABC story, some shelves lost almost 20% of their thickness.

Melting ice shelves does not itself cause sea level rise, but the shelves buttress land ice, which then becomes more mobile. The graph in the bottom corner of the image shows that East Antarctica is now also experiencing a net loss of ice from ice shelves.

2. Top polluters to set own limits virtually penalty free

ANU economist Frank Jotzo said the system is designed so no-one gets caught by it – a toothless tiger. Tony Wood of the Grattan Institute said the ideas proposed in the paper simply would not work. They were commenting on a Government consultation paper outlining “safeguards” to ensure the big polluters do not offset emissions saved through the Emission Reduction Fund (ERF), a flagship component of Direct Action.

Australia’s 140 top polluters will set their own limits for future pollution virtually penalty free, according to the Government’s latest Direct Action policy paper.

Companies subject to the safeguards will select a baseline, or limit, for future pollution.

That baseline will be set according to the highest peak of emissions from the past five years.

Just plain stoopid!

3. What’s going on in the North Atlantic?

Stefan Rahmstorf asks the question at RealClimate. There is a large patch in the North Atlantic which has cooled in the last century.

Rahmstorf_2015_1rc_600

Rahmstorf explains:

Our recent study (Rahmstorf et al. 2015) attributes this to a weakening of the Gulf Stream System, which is apparently unique in the last thousand years.

In fact during last winter, which was the warmest on record for the planet overall, this patch had the coldest temperatures on record.

Chief suspect has to be the increasing freshwater coming off Greenland. There will be consequences.

The consequences of a large reduction in ocean overturning would look nothing like the Hollywood film The Day After Tomorrow. But they would not be harmless either – e.g. for sea level (Levermann et al. 2005) particularly along the US east coast (Yin et al. 2009), marine ecosystems, fisheries and possibly even storminess in Europe (Woollings et al. 2012).

A complete breakdown of the current was given up to a 10% chance this century in the IPCC report. This may have been an underestimate.

4. Rapid Arctic warming is changing the Jetstream and the weather

Another study, also involving Rahmstorf, looks at changing atmospheric circulation patterns due to Arctic warming.

The Arctic is warming faster than lower latitudes. The Jetstream velocity depends on temperature difference, hence it is slowing. It is also more wavy and has a tendency to get stuck, so heat or cold persists over a large area. Ironically, there is less storminess. Storms transport water onto land and break up persistent weather patterns.

The jet stream that circles Earth’s north pole travels west to east. But when the jet stream interacts with a Rossby wave, as shown here, the winds can wander far north and south.

Jet stream_b7acb6bc-724d-4e2e-9078-17bb01ce052b-550

5. Brisbane EV charging technology takes on the world

Brisbane-based electric vehicle infrastructure company, Tritium, has done a deal to supply its award-winning Veefil DC fast charging stations to America’s ChargePoint company. ChargePoint has 21,000 EV chargers around the US.

The Australian-made stations will be installed on major routes across the country, including the express charging corridors on both the east and west coasts of the US that are being built as part of a recent deal between ChargePoint, Volkswagen and BMW.

The 50kW Veefil stations – which in the US will be called DC Fast stations and will be ChargePoint branded – are able to deliver up to 80 miles or 128 kilometers of charge in just 20 minutes, thus removing one of the key barriers to EV uptake: range anxiety.

Big Oil’s business model – broken?

oil rig_6a00d8341d320d53ef0134855026ce970c-800wi

Michael T Klare in an article at Grist claims that Big Oil’s business model is broken.

I’m not so sure. An IEA (International Energy Association) update which he cites is titled A business-as-unusual outlook for oil in the medium term. Certainly there have been changes since the IEA’s World Energy Outlook 2014 (see my recent post).

Last September in the Outlook document the IEA saw oil prices rebounding, averaging $82.50 a barrel in 2015 and rising to near $100 in the coming years. Now they see prices recovering gradually to reach $73 a barrel in 2020.

The IEA now sees production as increasing by 5.2 million barrels per day over the same time period, which is substantially the same as forecast last September.

The IEA sees four main factors at play:

  • Emerging economies are reaching a less oil intensive stage of development.
  • The global economy is becoming less fuel intensive.
  • Concerns over climate change are affecting policies, for example the fuel economy regulations for motor vehicles in the US, which Klare says will reduce demand by 2.2 million barrels per day by 20125.
  • Globalisation of the natural gas market and the emergence of renewable technologies has led to inter-fuel competition beyond what would have been expected only a few years ago.

North American unconventional production (light tight oil, or LTO) has been greater than expected and has become the top source of incremental supply. Iraq supply increase is also beyond expectations.

Klare’s major point is that the oil industry assumed that demand would continue unabated no matter what the price, leading to massive investment in what he calls “tight oil” – oil from unconventional, hard to get at sources. His thesis is that production and consumption will increase, but only slowly, and to an extent and at a price that will not justify the investment necessary to extract tight oil.

The investment in tight oil dates from 2005, when production was 85.1 million barrels per day. At that time the IEA forecast that demand would reach 103.2 million barrels per day in 2015. In 2014 it was 92.9 with the forecast for 2015 only 93.2.

On the price recovery from $55 per barrel to $73 in 2020, Klare says:

Such figures fall far below what would be needed to justify continued investment in and exploitation of tough-oil options like Canadian tar sands, Arctic oil, and many shale projects. Indeed, the financial press is now full of reports on stalled or cancelled mega-energy projects. Shell, for example, announced in January that it had abandoned plans for a $6.5 billion petrochemical plant in Qatar, citing “the current economic climate prevailing in the energy industry.” At the same time, Chevron shelved its plan to drill in the Arctic waters of the Beaufort Sea, while Norway’s Statoil turned its back on drilling in Greenland.

In that sense Klare is right. Also profits like $32.6 billion in 2013 for Exxon (second only to Apple) and $21.4 billion for Chevron are unlikely to continue. Nevertheless these firms are not out of business. Some of the smaller producers in the sense of firms and countries may be, leading to possible failed states and security concerns. Russia will be producing less.

The bottom line, though, is that the crystal ball is clouded. Uncertainty prevails.

Climate clippings 131

1. Totten Glacier

In Climate clippings 124 I mentioned concerns about Totten Glacier in East Antarctica, which is actively melting. It’s now in the news again. Dr Tas van Ommen:

“We’re realising that the East Antarctic ice sheet’s probably not the sleeping giant that we thought or at least, the giant’s starting to twitch and we’re concerned,” he said.

This article has a map showing the size of the glacier catchment, more than double Victoria:

Totten_6326094-3x2-600

Essentially with East Antarctica on the move, estimations of sea level rise this century could be underdone. We simply don’t know.

2. Great Barrier Reef ‘saved’

The Federal and Queensland Governments have together released the final version of the long-term plan for the Great Barrier Reef.

The Reef 2050 Long-Term Sustainability Plan satisfies one of the key recommendations made by the United Nation’s World Heritage Committee and forms a key plank in the Governments’ bid to avoid the site being declared “in danger” by UNESCO.

The report warns climate change is the biggest long-term threat facing the reef, while the immediate pressures include water quality, which has declined due to nutrient and sediment runoff from agricultural production.

Previously, a draft version of the report was criticised by some scientists as being a plan for sustainable development rather than protecting and conserving the reef.

The Queensland Government also sought urgent changes to the draft, to include its $100 million election commitment to improve water quality.

These news items never mention ocean acidification. As I’ve repeatedly warned:

It has been shown that “preserving more than 10 per cent of coral reefs worldwide would require limiting warming to below +1.5°C (atmosphere–ocean general circulation models (AOGCMs) range: 1.3–1.8°C) relative to pre-industrial levels”.

3. France says new rooftops must go green

According to a new French law approved on Thursday, rooftops on new buildings in commercial zones across France must either be partially covered in plants or solar panels.

France has lagged behind other major European countries like Germany, Italy and Spain in solar power development. As of last summer, France had just over five gigawatts of photovoltaic capacity, accounting for around one percent of total energy consumption. Germany has nearly 40 GWs installed.

France has relied on nukes for 83% of its power.

4. Are the UK’s emissions really falling?

Traditional emissions accounting only considers the greenhouse gases generated within a country’s own borders. In other words, emissions produced in the UK are allocated to the UK. On this measure, UK emissions have fallen dramatically to around 25% below 1990 levels.

But when the source of emissions generated by products consumed within the UK are counted, emissions have only fallen by 7%. This is the pattern over time:

UK emissions_screen-shot-2015-03-19-at-144932_599x299

The UK’s production emissions have fallen fast (dark blue area), but imports have offset much of the gain (lighter blues, purples and grey area). Clearly things changed after the GFC in 2008.

5. Germany penalises dirty coal power

Germany plans to force operators of coal plants to curb production at their oldest and most-polluting power stations, as part of efforts to achieve its climate targets, senior government sources said yesterday. Under the measures, the government plans to allow coal plants to produce 7 million tonnes of carbon dioxide per gigawatt of installed capacity, but any produced above that level would be subject to a fine of 18 to 20 euros per ton.

6. Australia’s top ten emitters

Planet Oz takes a look at an ACF report on Australia’s top polluting companies. From the report here they are:

Top 10 polluters_cropped_600

Seven are energy companies, three are miners.

However, if you took the emissions generated from the products they produce, a very different picture would emerge. Rio, for example comes fourth with emissions of 18 million tonnes of CO2 last year. Yet Rio’s customers burning coal produce a further 129 million tonnes.

7. Climate change ‘exacerbated’ Cyclone Pam damage

That’s according to the Climate Council, (but see Item 8 below).

“Higher surface temperatures can mean that you have higher wind speed and more damaging rainfall,” Amanda McKenzie from the Council said.

“And what we saw in Vanuatu was in the lead-up to the cyclone, sea surface temperatures were well above average.”

Ms McKenzie said rising sea levels would multiply the damaging effects of cyclone storm surges.

Cyclone Pam, a category-5 storm with wind gusts reaching 300 km/h, struck Vanuatu on 13 March 2015 leaving twenty-four people dead, 100,000 people homeless and up to 70% of the nation’s 69,000 households damaged.

8. Cyclone Pam and Climate Change

Stefan Rahmstorf at RealClimate takes a look at whether climate change had an effect on Cyclone Pam.

My take is, quite possibly, but we can’t know for sure.

The basic problem is that the satellite record only goes back to around 1980, which is not long enough, and only in the North Atlantic are cyclones surveyed by aircraft and then only if they threaten populated regions within a few days.

A study by Kossin et al (2013) looked at the satellite data record from 1982 to 2009 and found an increase of 2.5 m/s per decade for high intensity events (Pam appears to have reached an intensity of around 75 m/s).

Other factors to look out for include the amount of rain delivered, changes in genesis locations and tracks, and diameters, all of which should be affected by climate change.

Haiyan and Pam, two of the most severe tropical cyclones on record, have struck the western Pacific in the past 16 months.

Climate clippings 130

1. Manicured lawns produce more greenhouse gases than they soak up

Grass_cropped_550

Researchers found:

that a hectare of lawn in Nashville, Tennessee, produced greenhouse gases equivalent to 697 to 2,443kg of carbon dioxide a year. The higher figure is equivalent to a flight more than halfway around the world.

Continue reading Climate clippings 130

IEA world energy outlook 2014

By 2040 three quarters of our energy will still come from fossil fuels, with global energy demand increasing by 37% and emissions increasing by 20%, according to the IEA world energy outlook 2014. IEA Chief Economist Fatih Birol:

The International Energy Agency estimates the planet is on track to warm by 3.6 degrees Celsius. Investment in renewables needs to quadruple to an average of $1.6 trillion every year through 2040 to meet the 2-degree target.

Taking the world’s CO2 budget to limit warming to 2°C as 2,300 Gt of CO2 from 1900, we have 1,000 Gt left from 2014, and are set to use all of it by 2040:

CO2 budget_dropped

Overall energy demand is set to grow by 1% pa, about half the growth experienced in recent decades. Demand is flat in the OECD, slowing in China, but growing vigorously in the rest of the world:

Growth_cropped_600

By 2040, the world’s energy supply mix will divide into four almost-equal parts: oil, gas, coal and low-carbon sources, including renewables, hydro and nuclear. Growth in oil and coal will taper to nothing, but gas will grow vigorously, with demand increasing by 50% by 2040.

Oil

World oil supply rises to 104 million barrels per day (mb/d) in 2040, but hinges critically on investments in the Middle East. As tight oil output in the United States levels off, and non-OPEC supply falls back in the 2020s, the Middle East becomes the major source of supply growth. Growth in world oil demand slows to a near halt by 2040: demand in many of today’s largest consumers either already being in long-term decline by 2040 (the United States, European Union and Japan) or having essentially reached a plateau (China, Russia and Brazil). China overtakes the United States as the largest oil consumer around 2030 but, as its demand growth slows, India emerges as a key driver of growth, as do sub-Saharan Africa, the Middle East and Southeast Asia.

The changes in supply are shown graphically below:

Oil_cropped_600

Concern is expressed that ISIS is deterring investment in production in Iraq.

Oil prices are likely to rebound, averaging $82.50 a barrel in 2015 and rising to near $100 in the coming years.

Coal

Global coal demand will grow by 15% to 2040, but almost two-thirds of the increase will occur over the next 10 years.

Chinese coal demand plateaus at just over 50% of global consumption, before falling back after 2030. Demand declines in the OECD, including the United States, where coal use for electricity generation plunges by more than one-third. India overtakes the United States as the world’s second-biggest coal consumer before 2020, and soon after surpasses China as the largest importer.

Australia will pass Indonesia to once again become the largest exporter by 2030.

The graph shows the importance of China in the global market:

Coal_scropped_600

The graph also highlights the folly of India and developing countries polluting their way to prosperity.

Gas

The key uncertainty – outside North America – is whether gas can be made available at prices that are attractive to consumers while still offering incentives for the necessary large capital-intensive investments in gas supply; this is an issue of domestic regulation in many of the emerging non-OECD markets, notably in India and across the Middle East, as well as a concern in international trade.

If these uncertainties are met the world gas market will be transformed with Australia a major beneficiary:

Gas_cropped_600

60% of gas will be ‘unconventional’, meaning shale and coal seam.

There is uncertainty about the $900 billion per year in upstream oil and gas development needed by the 2030s to meet projected demand.

Nuclear

The IEA sees global nuclear power capacity increasing by almost 60%. However, its share of global electricity generation will rise by just one percentage point to 12%.

Some 38% of existing capacity will be retired. Once again the importance of China is seen in this graph of the changes in capacity of the key players:

Nuclear_cropped_600

Renewables

Renewables will account for almost half of the increase in total electricity generation to 2040.

The share of renewables in power generation increases most in OECD countries, reaching 37%, and their growth is equivalent to the entire net increase in OECD electricity supply. However, generation from renewables grows more than twice as much in non-OECD countries, led by China, India, Latin America and Africa. Globally, wind power accounts for the largest share of growth in renewables-based generation (34%), followed by hydropower (30%) and solar technologies (18%).

Global subsidies amount to $120 billion compared to $550 billion for fossil fuels.

The growth in hydropower is an ecological concern.

Paris and prices

The Executive Summary leads with a statement about the uncertainty of energy futures in very troubled times, so the IEA forecasts must be seen in this light. The IEA is urging strong intervention by decision makers in the UNFCCC conference in Paris in December, to avoid a climate catastrophe. They call it the last chance. Worth noting here is that the 2011 World Energy Outlook found that all new power supply built after 2017 would need to be zero carbon.

I’m not sure the IEA is fully aware of how cheap renewable technologies are becoming, and how disruptive these technologies will be. Nevertheless their mainstream future, dubbed the “central scenario”, already has renewables comprising about half of new capacity. The changing pattern in power supply is captured as follows:

Power capacity by source_cropped_600

Clearly we are relying too much on gas and coal for new supply, and we need to retire more dirty power, especially brown coal.

Sources

Unfortunately one can’t read the full report without buying it so I’ve had to make do with links, mostly from this page. The Executive Summary provides the story in words, the pictures all come from the London presentation.

See also Peter Hannam at the SMH, my 2011 post on the 2011 report and Climate clippings 103, Item 4 for a brief treatment of World Energy Investment Outlook 2014.

Also relevant is Mark Diesendorf’s plan for 100% renewable energy in Australia.

BP’s vision

Finally, BP has taken a look at the future. What they find is not dissimilar to the IEA, just heading down the crapper a bit faster. They see global energy consumption in 2035 as 37% greater than now and CO2 emissions 25% more. They see a clear role for themselves to make a buck while cooking the planet.

Climate clippings 129

1. Polar bears – uncertain future

The Mail on Sunday recently declared the polar bear in good shape on the basis of the opinion of biologist Dr Susan Crockford, who says:

“On almost every measure, things are looking good for polar bears … It really is time for the doom and gloom about polar bears to stop.”

It turns out that Crockford’s expertise is the archaeology of dead dogs and the identification of animal remains, and receives funding from the Heartland Institute to spread disinformation about human agency in climate change.

Information, reliable or not, is difficult to come by. This is a snapshot of one estimate of how the polar bear is travelling:

Polar bears_screenshot-2015-03-04-154610_575x539

In nine of the 19 populations of polar bears information is deficient.

On their future the best estimate is:

To keep polar numbers relatively healthy, though still lower than today, scientists suggest global temperatures should not exceed 1.25 degrees Celsius above the 1980-1999 average.

2. Arctic sea ice is getting thinner faster than expected

Measuring the thickness of the Arctic sea ice sheet is not a simple matter. data from disparate sources has been brought together for the first time.

in the central part of the Arctic Ocean basin, sea ice has thinned by 65% since 1975. During September, when the ice reaches its annual minimum, ice thickness is down by a stunning 85%.

3. UK auctions for renewables

Contracts worth £315 million have been awarded to 27 renewable energy projects with a combined capacity of 2.1 gigawatts.

The majority of the 27 schemes are windfarms, including 15 onshore and two offshore schemes (the blue and green chunks below). The remaining contracts went to five solar farms (yellow) and five schemes that will burn or gasify waste to generate energy (black and grey).

UK_Screen Shot 2015-02-26 at 15.48.48_600

By peak capacity the outcome looks rather different:

UK_Screen Shot 2015-02-26 at 15.48.54_600

The auction was divided into two pots, with one pot reserved for “less established” technologies.

The big surprise was the prices, which were lower than expected.

4. Keystone XL pipeline bill vetoed

It’s important to note that the pipeline bill has been vetoed, not the pipeline.

Keystone is not dead. The bill was a political Tea party move to pre-empt State Department approval, which will now continue until a recommendation in made to John Kerry as Secretary of State.

Meanwhile Nebraska landowners are fighting a case in the courts. They claim state law giving TransCanada the right to drive the pipeline through their land under ’eminent domain’ is unconstitutional.

If the landowners succeed TransCanada does not have a route for the pipeline.

A longer post on the issue is here.

5. The IPCC reviews it’s processes

Every seven years the IPCC publishes three whopping reports followed by a Synthesis Report. Working Group 1 looks at the physical basis of climate change. Working Group 2 looks at impacts, adaptation and vulnerability. Working Group 3 looks at mitigation. Each of these whopping tomes has a Summary for Policy Makers of about 30 pages.

The main decision is that the program will continue with some minor modifications. They will try to link the second and third volumes more specifically to the first, while producing the whole series within about 18 months.

More special reports on specific issued will be produced during the interim years.

They will try to make the summaries for policy makers more readable.

6. NZ infestation of flat-earthers climate denialists

The Dominion Post is the newspaper of record for New Zealand’s capital city, Wellington. Last Friday it featured an opinion piece by high profile climate denialists Bob Carter and Bryan Leyland titled Hypothetical global warming: scepticism needed. Gareth Renownden at Hot topic calls it

a “Gish Gallop” of untruths, half-truths and misrepresentations — a piece so riddled with deliberate errors and gross misrepresentations that it beggars belief that any quality newspaper would give it space.

He then identifies 24 specific errors or misrepresentations.

7. EU adopts climate change targets for Paris conference

The EU formally adopted on Friday climate change targets for December’s Paris conference including a 40 percent cut in emissions by 2030, climate commissioner Miguel Arias Canete said.

The targets were agreed on by leaders of the 28 European Union member states at a summit in October, but the confirmed benchmarks have now been officially sent to the UN, Canete said.

The EU was the second after Switzerland to publish its submission.

In other EU news, the Commission is to spend €100 million on projects aimed at connecting energy networks across the continent.

8. El Niño finally arrives

El Niño has finally arrived at a time of the year when they usually decay. It’s weaker than usual and is unlikely to have much impact on world weather.

9. US weather conundrum

Last week I reported (Item 1) that the planet had just experienced the hottest 12 months, while it was freezing in eastern North America during January and February and into March.

Because winter includes December and December was mild, no state had a record low winter. In fact the East’s brutal cold was offset by record warmth in the West, which was caused by warmth in the Northern Pacific. The experts think this pushed the jet stream out of shape, bringing Arctic air further south in the east.

It seems the Northern Pacific warmth has now moved to the Central Pacific, causing the weak El Niño referred to above.

Reminder Climate clippings is an open thread and can be used for exchanging news and views on climate.

IGR – garbage in, garbage out

I’ve borrowed the title from The Australia Institute because it reflects how I feel about the Intergenerational Report.

IGR_1425344117771_220

Hockey told a business briefing “When people see some of the graphs in the intergenerational report they are going to fall off their chairs.” Richard Denniss said, yes, “we’re rolling around on the floor laughing”. He finds it “a deeply flawed document based on deeply flawed assumptions.”

Peter Martin warned us that when governments lose their authority, they try to scare us. Michelle Grattan warned that the government wanted the public to take several political messages out of the IGR:

Stated crudely, these are: first, that Labor’s policy settings would have taken us to hell in a hand basket; second, that but for the pesky Senate, the budget would have been in good shape relatively soon; and third, that despite the obstacles, the government is making progress towards bringing us to fiscal health.

She was right.

The Intergenerational Report is accessible here. See also the ABC article and The Conversation’s panel of experts.

Three scenarios

The Report paints three scenarios. The first dubbed “Proposed Policy” is the Abbott Government’s 2014 Budget. It would bring a surplus within five years. That is, if the revenue stream holds up as predicted, which we know it hasn’t. Also some ‘saves’ of the budget have been abandoned. That’s the first bit of fiction.

The second scenario is termed “Currently Legislated Policy”. That’s what the Opposition, the Greens and crossbench senators have passed. That will lead to a deficit of 6% of GDP in 2055.

The shock horror is in the third scenario, called “Previous Policy”. We are meant to believe that this is what the LNP inherited from Labor. In 2055 on this scenario the annual deficit would be a whopping 11.7% of GDP, with net debt at 122% of GDP.

The deception here is that the Report has not used Labor’s legacy as reflected in the Pre-Election Fiscal Outlook (PEFO) prepared independently by Treasury and Finance and published under the charter of budget honesty in August 2013 before the last election, which had the budget coming into surplus in 2015-16. It has used Hockey’s first Budget Update, after he had added billions of dollars of debt.

The IGR is a document compiled by the Treasurer, not the Treasury. Chris Bowen says that Labor would legislate to have it compiled by the Parliamentary Budget Office to take out the politics.

Affordability

The Report has put in some scary figures like number of centenarians will grow from 5,000 or so now to almost 40,000 in 2055, spending on aged care and pensions will from from 2.9% of GDP to 3.6%. That’s an increase of 24% when our average income is forecast to lift from $66,400 today to $117,300, or 76%. If that is true (I have my doubts) then we can live very decently and still afford welfare.

Dependency ratio

A really scary figure given is the dependency ratio, which is the number of people of working age (15-65 year-olds) to aged people (65+). The dependency ratio is 4.5 now and will reduce to 2.7.

Again I say, why should we worry that the number of workers is reduced by 45% when each worker will be earning 76% more.

John Quiggin reckons it’s a weird trick that proves the IGR is nonsense. The concept assumes:

* Children aged 14 and under cost nothing to raise and required no public expenditure on schools, daycare etc
* Children leave school at 15. After this, they not only support themselves, but contribute to the support of those over 65
* People retire become eligible for age pensions at 65.

All three are wrong.

Climate change, the environment and population growth

Richard Denniss says the Report is unrealistic because it “barely talks about the threats of climate change or the enormous cost of building the new infrastructure that rapid population growth will require.”

Ian Lowe says:

There is no sign the government even recognises the most serious threats to future generations: liquid fuel security, climate change, water shortages, loss of productive land and loss of biodiversity. These issues require planning and commitment of resources now.

Rapid population growth to reach 39.7 million is taken as a given, not something we have a choice about.

On climate change Ben Eltham says:

Climate change is the dominant geopolitical fact of the future. It will shape the future more surely than tax takes or pension liabilities. It will reshape the global economy, threaten food yields, increase natural disasters, lay waste to Australia’s region and generate hundreds of millions of refugees.

Such blunt realities are absent everywhere from the 2015 IGR. It’s denial writ large, pure and simple. A larger blind spot – a more willful inapprehension of reality – is hard to envisage.

I’d have to agree with his bottom line:

You don’t have to take such shoddy work seriously, and as a busy citizen, you shouldn’t. The Intergenerational Report is not a serious attempt to make projections about government policy. It is an ornament, a prop in a policy theatre, a bell-and-whistle for the next Treasury lockup.

Like most such reports, the IGR will be quickly forgotten.

Update: The Parliamentary Library site Flagpost has a useful comparison of the four IGR reports so far.

Keystone XL pipeline bill vetoed

20081104-alberta-tar-sands

President Obama has vetoed a bill to approve construction of the controversial Keystone XL pipeline, which would bring tar sands oil from Canada down to Texas refineries on the Gulf coast.

It’s important to note that the pipeline bill has been vetoed, not the pipeline.

For starters, pretty much everyone has noted that Keystone is not dead. All the veto means is that Congress isn’t able to force the pipeline’s construction through legislation — the process is just going back to being centered on the State Department’s administrative review procedure, as it largely has been for the last six years.

The State Department will consider the proposal and in their own good time make a recommendation to John Kerry as Secretary of State.

The bill was a political Tea party move to pre-empt State Department approval.

Meanwhile important court proceedings are taking place in Nebraska and South Dakota. The pipeline authority TransCanada is claiming ’eminent domain’ giving then the right to drive the pipeline through properties. About 90 Nebraska landowners claim that state law giving TransCanada the right to seize land under eminent domain is unconstitutional.

If the landowners succeed TransCanada does not have a route for the pipeline.

At Climate Central we learn that

the energy required to process tar sands oil is so great that oil piped through the Keystone XL will emit 1.3 billion more tons of greenhouse gas emissions over the pipeline’s 50-year lifespan than if it were carrying conventional crude oil.

President Obama has said he would only approve Keystone XL if it didn’t significantly increase carbon emissions. To me that makes the decision quite straightforward, but the argument is being put that the tar sands will be developed anyway, so the pipeline makes no difference.

Obama has said also that there is no need for the US to use oil from tar sands. Apparently energy security is a factor in his thinking.

A new study suggests that the majority of the oil will be used in the US.

My guess is that Obama does not want a tar sands pipeline approval as part of his legacy.