Hockey’s debt and deficit mess

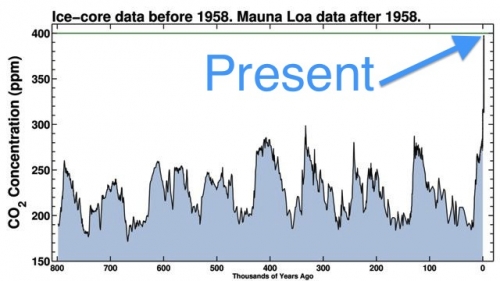
In their usual sloganeering fashion Abbott, Hockey, Cormann and others constantly refer to the ‘budget debt and deficit mess’ (or disaster) they inherited from Labor. In the post Resolving the budget ‘crisis’ I attempted to show that Labor left the budget in reasonably good shape. In so far as there is a mess or a crisis now, the author is Hockey and company.

From comments I may have not made the case plain. In what I hope is my last post on the budget of 2014, I lay out the case again, with additional information.

In the 2013 budget Wayne Swan went beyond the usual four-year projections to lay out expected receipts and payments over 10 years. He did this to reflect how the numbers would work out, given that the major payments for Gonski and NDIS did not cut in until after the four-year budget cycle. Swan left the budget in good fiscal shape.

When Bowen and Rudd took over from Swan/Gillard they had to rejig the budget to accommodate the early change from a fixed carbon price to carbon trading, plus some new policies. Labor’s legacy is reflected in the Pre-Election Fiscal Outlook (PEFO) prepared independently by Treasury and Finance and published under the charter of budget honesty in August 2013 before the last election is shown:

fcccad64-03b4-11e3-9d44-7643a0300d9c_chart1_580

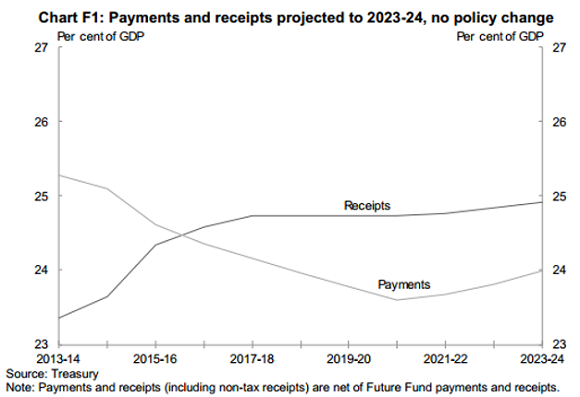
This graph has the budget back in surplus in 2015-16, an ongoing surplus of about 1% of GDP (about $16 billion) and a restoration of budget receipts to about 25% of GDP. The forecast assumed no tax cuts to offset bracket creep. In effect the government would take back some of the eight tax cuts delivered by Costello and the one delivered by Rudd.

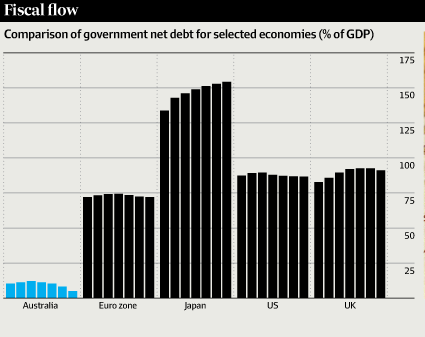
Six years of Labor had seen debt increase through the unaffordable tax cuts and Keynesian stimulation to counter the GFC. Nevertheless debt was modest by international standards.

Here’s Labor’s debt in context:

Debt_35d9ec68-d401-11e2-a269-28d841715c70_14p22bassRESIZED_cropped

Hockey has done three main things.

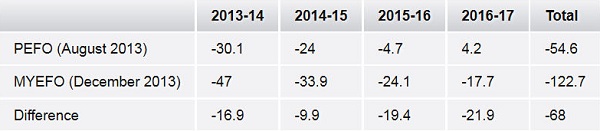
First, he has added $68 billion in debt over the four-year budget cycle.

Second, he has delayed major cuts until the fourth year, as Ross Gittins has pointed out. (Ironically he has done this to stimulate the economy in transition from reliance on the resources boom. In fact consumer confidence tanked from the pre-budget talk of austerity and remains at levels of the 1991 recession.) Hence the budget does not reach surplus until 2016-17, one year later than Labor.

Third, Hockey has restrained receipts to 23.9% of GDP, according to Gittins, one election promise he has kept. Hockey has put the budget into a straight jacket entirely of his own making. This decision is based on his austerity/small government ideology.

The transition from Swan to Bowen to Hockey is reflected in this graph a form of which was published in the AFR at the time of the Mid-Year Forecast and Economic Outlook (MYEFO) last December.

951e60a8-66d4-11e3-b959-55a7b594860c_MidYear-onlineV3_cropped_580

Swan’s embarrassment and a fair bit of the negative view of Labor’s reputation as an economic manager is reflected in the difference between MYEFO for 2012 and the 2013 budget. Swan/Gillard had bravely forecast a budget surplus for 2012-13, but had to give up and defer for two years because of failing revenue. Treasury and Finance seemed to be completely blindsided by what was going on but the repeated failure of revenue to meet forecasts made the government look incompetent.

I understand revenue picked up a bit in the weeks before PEFO 2013, mainly due to better receipts from the mining and carbon taxes. I believe it was stable between PEFO 2013, Labor’s legacy, and MYEFO 2013, Hockey’s mess.

You will recall that the from ABC Factcheck confirmed Bowen’s contention that Hockey added $68 billion of debt to the forward estimates:

PEFO_cropped_600

In the overall narrative the focus should be on what Hockey has done in increasing the deficit and in establishing a 23.9% of GDP limit on receipts. Instead we have sloganeering and a welter of numbers in an attempt to sheet home the entire blame to Labor. The LNP keeps saying that they gave us the budget the country needed and that there was no choice. There was choice in the overall budget framework as well as the allocations within it, which privileges the rich and the corporates and punished everyone else. Infrastructure and defence have also received increases, beyond normal inflation, though the former is limited to roads, neglecting public transport.

abbott_hockey_main-250

One sloganeering tactic is to state (true) that we are paying $1 billion in interest every month, and then rattle off what could be achieved with $12 billion extra in the budget. This entirely overlooks the need for debt to counter the GFC and the state we would have been in had we followed LNP policies.

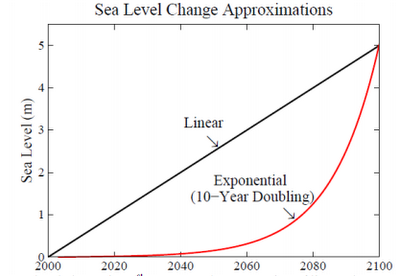
Another is to say that if nothing were done then in 10 years the debt would be $667 billion pa. No economic commentator has had a good look at this claim, but it’s based on the Hockey mess, not Labor’s as such.

Based on that $667 number, they now have dazzled everyone with a ‘blizzard’, to borrow Bernard Keane’s description, of numbers derived from it. The interest bill becomes $2.8 billion per month, or $25,000 for each man, woman and child in the country, $100,000 for a family of four. Each Australian’s share of the interest would be $9,400 over the next 10 years, and so on and on.

Keane says it’s a Howard trick, although Howard had the gumption to stick to one number. Does anyone remember the ‘Beazley black hole’, the gigantic deficit left to the Howard government in 1996? This graph shows the budget balance history going back to when Howard was treasurer:

Budget balances_cropped_600

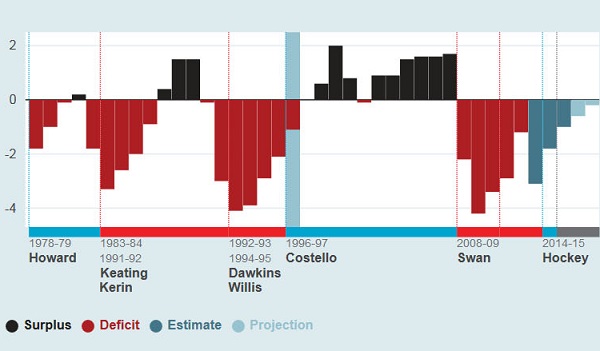
The graph is interactive. I’ve taken a screen shot with the blue marker bar over the socalled “Beazley black hole” It wasn’t a black hole and it wasn’t even Beazley’s as he was finance minister; Ralph Willis was treasurer. The deficit in that year was a benign 1.1% of GDP.

[This graph has replaced the less good one I had in the original post.]

The Tories have form, they specialise in lies. I’m inclined to think this present lot are liars, clunkheads or both, Laura Tingle’s assessment in 2010, and unfit for government.

Update: ABC FactCheck have done a thorough analysis of Hockey’s claim that

“At the moment we’re paying a billion dollars a month – one billion dollars every month in interest, in interest on the debt that Labor has left.”

Labor only incurred 75% of the current debt and there is a difference between gross debt and net debt. The verdict:

Using either gross debt or net debt, Mr Hockey’s claim that at the moment Australia is paying a billion dollars every month in interest on the debt that Labor left is exaggerated.

A nice way of saying he’s lying.

Previous posts on Budget 2014:

On a mission to upset everyone

Budget explainer

A crisis in trust

Shredding the fig leaf

Poll anger or a shift in the tectonic plates?

To GST or not to GST

Cap super, says Richard Denniss

Resolving the budget ‘crisis’

See also especially Hockey’s morality play.

Climate clippings 98

This edition includes important updates on Greenland and Antarctica, global food supply, CSIRO cuts, CO2 levels moving decisively past 400 ppm and CO2 compared to global temperature rise.

1. Greenland may melt faster than expected

You may recall from the post Arctic images I included an image of the underlying topography of Greenland (Figure 5). It is saucer-like with large areas inland below sea level. The glaciers tend to drain through narrow gateways in the external rim. So they tend to be narrow and fast-flowing:

Glacier_assets-climatecentral-org-images-uploads-news-5_16_14_Andrea_Greenlandglacier-500x331

The mouths of most glaciers are melting from contact with warmer seas. It was felt that as this process continued the ice would lose contact with the water, slowing the melting.

New studies of the topography have shown that many of these channels are below sea level.

Valleys underlying many of the glaciers stay below sea level and extend much farther inland than previously suggested, so warm ocean currents that have migrated northward with the changing climate could eat away at the ice for much longer than current climate models suggest. “It will take much longer for these glaciers to lose contact with the ocean,” study author Mathieu Morlighem, of the University of California, Irvine, told Climate Central.

2. Melting Antarctica could devastate global food supply

A new report is the “first to factor in the effects of the slow-motion collapse of the Western Antarctica ice sheet on future food security.”

About time, I’d say.

The report acknowledges recent findings that that the retreat of the Western Antarctica ice sheet was unstoppable – and could lead to sea-level rise of up to 4 metres over the coming centuries.

“That sea-level rise would take out half of Bangladesh and mostly wipe out productive rice regions in Vietnam,” Nelson told The Guardian. “It would have a major effect on Egyptian agricultural areas.”

“A sea level rise of 3 meters (10 feet) over the next 100 years is much more likely than the IPCC thought possible,” the report said.

In terms of absolute land loss, China would be at risk of losing more than 3 million hectares (7.4 million acres). Vietnam, India, Bangladesh, and Myanmar could lose more than 1 million hectares (2.5 million acres), the report said.

The report recommends a radical increase in expenditure on agricultural research, which has been in decline everywhere over recent decades.

3. CSIRO cuts

The federal government cut CSIRO’s funding by $111 million over four years, which will result in 500 job cuts.

Dr Borgas [president of the CSIRO Staff Association] said a plan to move the Aspendale Laboratories to the organisation’s larger site in Clayton had been previously discussed but had come to nothing.

He said it was unclear whether the relocation would reduce the research performed by the 130 staff, which includes ice core analysis, air quality and pollution research and climate and atmospheric modelling.

Most countries planning for a future increase their scientific research funding.

4. CO2 levels decisively pass 400 ppm

During April all 12 World Meteorological Organisation northern hemisphere monitoring stations passed the 400 ppm mark, the first time ever. This is how such a level compares to the 800,000 year ice core record:

assets-climatecentral-org-images-uploads-news-5_2_13_news_andrew_co2800000yrs-500x282

When was it last this high? Possibly 15 million years ago, when it was warmer and there wasn’t much ice around.

“This was a time when global temperatures were substantially warmer than today, and there was very little ice around anywhere on the planet. And so sea level was considerably higher — around 100 feet [30 metres] higher — than it is today,” said Pennsylvania State University climate scientist Michael Mann, in an email conversation. “It is for this reason that some climate scientists, like James Hansen, have argued that even current-day CO2 levels are too high. There is the possibility that we’ve already breached the threshold of truly dangerous human influence on our climate and planet.”

5. Global temperature and CO2

I came across this graph from the NOAA National Climatic Data Center plotting CO2 levels against temperature rise. While correlation does not mean causation there is simply no alternative explanation.

assets-climatecentral-org-images-uploads-gallery-TVM-Global_Temp_and_CO2_web-600

If you take out 1998, which can be regarded as an outlier, the socalled ‘pause’ is only apparent from 2005, which is too short a time to mean anything.

There is another view which sees temperature responding in step-wise fashion. On that basis we may be due for another step, and with an El Niño likely…

Here’s one showing the ten warmest years on record, all since 1998:

assets-climatecentral-org-images-uploads-gallery-climate-matters-GlobalRecapRanking_sm-400x225

Reminder: Use this thread as an open thread on climate change.

A Coast to Coast odyssey – Stage 1: St Bees to Cleator

Our C2C journey has finally begun!  There have been times over the last 2 years when I thought this day would never arrive.  At 66 years of age, health issues are never far from your mind …. my father sadly died at this age from a ‘heart attack’.  But my cardiologist says I’m good to go!  Listen to your body, he says. ‘If you feel like you need a rest, then have one’ …. these were his parting words. Sounds like good advice for everyone to me, no matter what their age!

When I awoke at 4.00 am (all the excitement), it was raining!

IMG_0247

But the rain eased and we enjoyed a cloudy, but mainly fine day.

So we departed our St Bees B&B, fortified with a full English breakfast and made our way down to the beach where the C2C starts.  Tradition has it that, before you start, you should dip your toes (boots) in the Irish sea and select a small stone to carry to the east coast to cast into the North Sea at Robin Hoods Bay.  Well …. we’ve started what may become a new tradition.  As well as dipping our boots in the water, we selected three stones.  The first was kissed with the second and then cast into the Irish Sea.  The second was secreted in each of our packs to be carried across England and then cast into the North Sea.  This will mark the conclusion of our C2C Odyssey at Robin Hoods Bay.  And the carefully selected third stone is a keeper (don’t worry, there are tons of rocks on the beach!).  So our journey begins ….

IMG_0252Here are three members of our team completing this ritual.  Doug, the Soil Scientist in our group would have no part in it.  It’s just not right to mess with the geology of England by carrying rocks from one side of the country to the other!  And as for carrying rocks to the other side of the world!

Then it was off to have the obligatory picture taken at the official starting point for the walk (see featured image) and we were on our way.

IMG_3990First we had to make our way up to the top of the St Bees headland, an ascent of about 100 m. Then  it was time to take a last look at the lovely St Bees and we were on our way.

IMG_0264It was close to high tide when we left, so there was only a rocky shore.  But when Julia Bradbury was here filming her 6 part TV series on the C2C (as screened on SBS several years ago), the tide was out, so there were several hundred metres of sand to traverse to reach the water’s edge.  No such problems for us!

The outstanding feature of our first day was the magnificent walk along the St Bees Head cliff-top.IMG_0270IMG_0272My co-walkers were setting a brisk pace, heading towards the first inlet in the headland – Fleswick Bay.  This is an area noted for its abundant birdlife on the cliffs.  And our first glimpse of the St Bees Lighthouse can be seen in the distance.

IMG_0284The views of the cliffs are simply spectacular.  And the bird-life is a twitcher’s paradise.  I know very little about birds, but enjoyed the spectacle of it, and captured a few images as we moved along.   IMG_4000a IMG_4007a IMG_4011a IMG_4021a


At one point, just beyond Fleswick Bay, a group of seagulls were hovering in the updraft of the cliff.

IMG_4024aIMG_4025aAnd a fight broke out immediately after this photo was taken! IMG_4028a
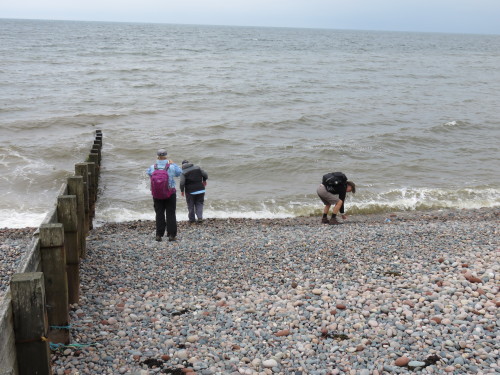
Different people walk at different speeds.  But some seem to move so quickly that it is difficult to see how they can appreciate their surroundings.  We called this group the Yorkshire fell flyers.

IMG_0293 We saw them approaching us from a distance way back behind Fleswick Bay and pretty soon they were on our tails and pressing to get past ….. in an area where the path was very close to the cliff-top and quite dangerous.  But we soon found a space to let them through.

IMG_0292The St Bees Lighthouse is interesting in that it was originally lit by burning coal.  I’ve not heard of this before, but apparently it was upgraded following many complaints from mariners about the poor quality of the light that it produced.  The facility is no longer staffed.  Sadly tours of the lighthouse that were available to C2C walkers until recently are no longer offered.

There is always a fence along the cliff-top.  Sometimes the path is on the land-ward side of the fence, as seen here.  These are predominantly sheep pastures.

IMG_0280 On other occasions, it is on the sea-ward side, and is quite dangerous in parts.  But a constant delight is the wildflowers that can be seen growing on the seaward side where they are protected from grazing.

IMG_0296 IMG_0286

In this area, the pastures are mainly grazed by sheep.  This little family seemed to be pretty content!  and there were mainly twin lambs in this area – good genetics, I think.

IMG_0276

And heading out into the Irish Sea, we saw a fishing trawler.

IMG_0288

It may well have caught our dinner …. four of us later had seafood for our evening meal in a local pub in Cleator.  In fact, Laurie declared that his Sea Bass dinner was the best meal he’d eaten since leaving home – even though he and Tricia had spent a week in Paris on the way to England!

A feature of our walking day is to boil the billy once or twice along the way.

IMG_0298We find this to be a pleasant and refreshing ritual.

IMG_0299Here, we were very close to an old quarry, the signal for us to turn east towards Robin Hoods Bay!  The C2C path then took us along some local roads as well dedicated walking paths to the small village of Sandwith (Pron: Sanith).  There was a pleasant village green and many attractive gardens.  This was a rare sighting of tulips – surprising to us given the time of year.

IMG_0303There was also quite a crowd enjoying a convivial interlude outside the local pub on their Monday Bank Holiday (what’s that all about …. we’ve had a few explanations?  But not sure?).

IMG_0305That’s our mob in the foreground having a little rest.  Definitely no ales until the walking is done!

We were soon in the small village of Moor Row, close to Cleator.  The final approach was along a very well constructed hiking and cycling path along a disused railway line.  And lots of lovely trees and shrubs along the way as well.  Should be more of them ….. nothing steep here!

We were all very pleased to see the sign for Jasmine House as our delightful overnight B&B hove into view.

Vital stats of Stage 1:

Distance – 14 km

Ascent – ca. 250 m

Level of difficulty – easy

Highlight – cliff-top walk

And finally, a note to long-suffering readers.  I’m new to blogging and so I’m learning ‘on the job’, with no-one to point me in the right direction.  Brian (my brother and the owner of this blog) kindly gave me a couple of quick lessons before I left home – without that I would have been sunk!  But you’ll be pleased to know that I am starting to swim faster!  As well, there has been no WiFi on several evenings, even in one case where the management claimed that my bedroom was the best place in the building to pick it up!  I’m also working with a notebook computer with Windows RT on it – new to me and not the best for blogging, I suspect.

So please bear with me if you wish to follow this account of our remarkable journey!  I’ll get the blogs up as quickly as I can.  But I suggest that you subscribe to this blog page – then, you will get an email when new posts appear and you’ll be able to follow our progress as I get them up!  (Too many exclamation marks, I know.  But I’m having that sort of experience.)


Brandis protects hate speech

Brandis_b9d63c08-e202-49b8-87c5-f481a3fef28e-200During the last week in March, before this blog came to life, Attorney General George Brandis introduced to parliament an exposure draft of changes to the S18c of the Racial Discrimination Act. Brandis goes beyond everyone’s “right to be a bigot”. He seeks effectively to protect the right of individuals, especially those working in the media, to use hate speech.

Much of the discussion and commentary has been in terms of free speech. I agree with Mark that this is to mistake fundamentally the aim of legislation against hate speech.

Its purpose is to provide redress against harm, harm felt by specific individuals and groups.

It’s not about freedom of speech. It protects speech which is justified on several grounds – including literary and artistic merit (so the argument about Salman Rushdie is entirely specious). It’s about not doing harm through the expression of hateful speech.

If we consider the effects of actually existing racism (or any other form of hate), it doesn’t take too much reflection to see that hurt leads to harm pretty quickly – it’s demonstrable in the impacts of hate speech on identity and thus wellbeing, and there’s a path from wounded identity to self harm, even suicide. (My bold)

Comments on the draft are now being considered by the Government. There’s a whisper that they reconsidering, but the question is still open. You can send Abbott/Brandis a message by signing this petition against hate speech.

In the following section I’ve laid out the nuts and bolts of the proposed changes.

Proposed changes to S18c

Simon Rice explains that the current test for racial vilification is “conduct causing offence, insult, humiliation or intimidation”. Offence, insult and humiliation have been dropped in the proposed changes. Verboten now is an act which is reasonable likely

(i) to vilify another person or a group of persons; or (ii) to intimidate another person or a group of persons.

Intimidate means to cause fear of physical harm:

(i) to a person; or (ii) to the property of a person; or (iii) to the members of a group of persons.

Vilify means to incite hatred against a person or a group of persons.

For an act to be unlawful it must must be “otherwise than in private” and must be done

“because of the race, colour or national or ethnic origin of that person or that group of persons.”

So the focus is now to be on vilification and intimidation (causing fear of physical harm). It’s OK to cause offence, insult and humiliate.

Vilification and intimidation are permissible if they involve:

words, sounds, images or writing spoken, broadcast, published or otherwise communicated in the course of participating in the public discussion of any political, social, cultural, religious, artistic, academic or scientific matter.”

Reasonableness

“is to be determined by the standards of an ordinary reasonable member of the Australian community, not by the standards of any particular group within the Australian community.”

The actual feelings of the target person or group are irrelevant.

Acts are to be judged independently of their actual effects, rather on what their effects would be if perpetrated on some mythical average member of the dominant group in society.

Discussion

To me, humiliating someone means putting them down, diminishing their esteem in their own eyes and in the eyes of others. To do that on the basis of race, colour or national or ethnic origin is to cause personal and social harm, is racist and frankly appalling. It’s a form of bullying, is tantamount to violence and should be illegal.

Some might argue that to tell the truth can involve offence and insults. Nevertheless I would argue that to offend or insult someone in relation to race, colour or national or ethnic origin means that you regard them as defective or inferior on those grounds. Again harm is done and I have no difficulty in making such acts illegal.

Truth telling appears to have no relevance to Brandis’s notion of free speech. A person can be humiliated, in public, by someone telling a pack of lies, and that’s OK.

Hate speech, racial intimidation and vilification in the public sphere is acceptable in Brandis’s world. To quote Michelle Grattan

In other words, anything goes in the name of free speech, accurate or not.

Vic Alhadeff reminds us that we will never have completely free speech:

“The late Justice Lionel Murphy said: ‘Freedom of speech is what is left over after due weight has been accorded to the laws relating to defamation, blasphemy, copyright, sedition, obscenity, use of insulting words, official secrecy, contempt of court and parliament, incitement and censorship’.”

That’s eleven categories imposing limits on what we are permitted to say in public.

All in all Brandis has cooked a rather nasty brew, emanating I’m afraid from a rather nasty cook. Brandis should remember that the robustness of parliament has resulted in suicide attempts. He seems to want to live in “a world of unrestrained biffo all round”, to borrow a phrase from Grattan.

Penny Wong:

“I think George saying this is about the rights of the bigots really laid bare the philosophy behind these changes.

“For them, it seems to be an abstract philosophical or legal argument. For them it’s a game, it’s a debate about words and abstract principles.

“For people who have experienced racism, it is a deeply personal debate, and it’s actually a debate about real people and real hurt.

“It’s a debate about real people in Australia, what happens on our buses and our trains, in the pubs on the football fields and on our streets. It’s about the message that our parliament sends and what I find missing, apart from the very offensive things in the debate, is empathy and compassion.”

Brandis has struck a blow for bigots, especially one bigoted journalist – Andrew Bolt.

Elsewhere

That was Ben Eltham at New Matilda.

Dennis Altman at The Conversation

Cristy Clark at The Conversation

Saturday salon 31/5

voltaire_230

An open thread where, at your leisure, you can discuss anything you like, well, within reason and the Comments Policy. Include here news and views, plus any notable personal experiences from the week and the weekend.

For climate topics please use the most recent Climate clippings.

The gentleman in the image is Voltaire, who for a time graced the court of Frederick II of Prussia, known as Frederick the Great. King Fred loved to talk about the universe and everything at the end of a day’s work. He also used the salons of Berlin to get feedback in the development of public policy.

Fred would only talk in French; he regarded German as barbaric. Here we’ll use English.

The thread will be a stoush-free zone. The Comments Policy says:

The aim [of this site] is to provide a venue for people to contribute and to engage in a civil and respectful manner.

Does getting a degree make sense?

ABC Factcheck looked at Christopher Pyne’s claim that university graduates, over a lifetime, earn 75 per cent more than someone who doesn’t go to university.  Factcheck found that the financial case for going to university varies considerably depending on who did the calculations, assumptions, the profession and the grades obtained.  This post uses some of the Factcheck data to ask whether going to university makes sense. Continue reading Does getting a degree make sense?

State of Origin 1

I decided I want to be there (here) as the dream continues, or, as it inevitably must, comes to an end. Also, there may even be one or two readers who are interested and care.

We are told that Qld have won the last five at “the cauldron”, that NSW hasn’t won a series opening here since 2003, but make no mistake, many recent games have been close. For example in 2012 it was one game all and Qld looked OK close to home in the decider at 20-14, when NSW put up an attacking bomb. The Qld player looked to have it covered when Josh Morris flew through the air, took it out of the Qld player’s hands and scored in the corner:

011326-josh-morris_500

The try was converted from the sideline, so suddenly it’s 20 all. Greg Inglis then almost slid over for a try, but hit the goal posts. Then Cooper Cronk sank the Blues’ hopes with a field goal at the death.

So either side can win.

A lot could be said about selection. Qld have gone light and perhaps mobile in the forward pack with only one big bopper (110kg or over). NSW have three.

Last year we had the disgraceful incident where Gallen punched Myles in the face, twice, and only missed one club match:

gallenpunch 500

Gerard Whately said he would have got 7 weeks in the AFL. It took until Sunday on Debbie Spillane’s program before anyone mentioned “One punch can kill!”

There won’t be any of that rubbish tonight.

Finally it is almost certain that we will be talking about the referees after the game. This year more than ever games are being decided on faulty or questionable refereeing decisions.

It should be a good game. In this part of the world there is only one other rivalry that comes close. That’s Australia vs NZ at netball.

Aust NZ netball

Resolving the budget ‘crisis’

We definitely have a looming political budget crisis. Whether there is a fiscal/economic crisis is a separate question. First the politics.

Mark has an excellent post wherein he poses three alternative scenarios. I have only two, because I don’t see Abbott, Hockey et al being able to negotiate the maze that faces them in the senate. Nor do I see the Liberals changing leaders. There simply isn’t anyone. Hockey has broken his brand. Turnbull isn’t interested and not enough will have him. They couldn’t choose Morrison, could they, although his stocks are said to be riding high, having stopped the boats.

1. Abbott fails to negotiate important elements of the budget, such as eliminating the carbon ‘tax’, the proposed changes to Newstart and Youth Allowance, the changes to the age pension etc. As promised, Abbott would call a double dissolution election, after some bipartisan changes to senate voting practices. But note well, Antony Green for complex reasons says:

In my opinion there is not going to be a double dissolution in the near future, and even in the more distant future, I cannot see any possibility of a double dissolution before late 2015 or the first months of 2016.

2. Antony Green thinks that Abbott will only call a double dissolution if he thinks he can win. In this scenario Abbott fails to negotiate the senate, and the polls stay unfavourable. Abbott wimps out and limps on to a regular election in the second half of 2016.

I would discount the second option. Someone pointed out recently that when challenged, Abbott becomes more determined; if you like, more pugilistic. Moreover it would be manifestly foolish to struggle on with a government that lacks authority in the parliament and can’t effectively govern without Clive Palmer, who would maximise his leverage.

Of course, the polls might change. Apparently the feedback from the electorate to the party room was horrendous. For example the Oz gives us a taste:

JOE Hockey’s friends say he has been taken aback by the poor response to his budget from Coalition MPs. Well, Treasurer, you’d be horrified to know what some of them really think.

“There’s been no narrative. It’s been all over the shop. One minute we say there’s an emergency, the next there’s $8 billion for the Reserve Bank, $12bn for fighter jets, and we’re still splashing out on the paid parental leave scheme,” says one.

Now the government is considering a budget ad campaign. Except that there won’t be any radio, TV or newspaper ads. The campaign will fill our letter boxes with letters and pamphlets. Apparently the recalcitrant and benighted voters need to understand that this was the budget that the country needed. Needed, that is, to fix the “Labor debt and deficit mess”. You’ll hear that phrase a million times before the next election.

Which brings us back to whether there is a crisis in the fiscal/economic sense.

Jacob Greber and Phil Coorey had an article on the front page of the AFR Budget crisis is real, says PBO:

Parliament’s independent budget adviser has rejected Labor and Greens’ claims the Abbott government has ­concocted a budget crisis, saying ­without action Australia’s debt will grow at one of the fastest rates in the developed world.

In remarks that effectively endorse government warnings that if left unchecked, gross debt would balloon to $667 billion, Parliamentary Budget Officer Phil Bowen said it was time to begin the return to surplus to protect the economy against future crises.

“It is time to start coming out [of debt and deficit], otherwise the longer you leave it the more exposed you become and the harder it is to wind it back,” he told The Australian Financial Review.

This is sad, really sad. On page 47, buried in the middle of a tiny opinion piece by Andrew Leigh we had the truth. Labor in the Pre-election Fiscal and Economic outline had the budget coming back to surplus in 2016-17 in an orderly way. Hockey plans to do it by 2017-18, with the most horrendous cuts.

The document Leigh refers to was prepared by Finance and Treasury and released in August 2013 as part of the charter of budget honesty. Remember this table from ABC Factcheck?

PEFO_cropped_600

Mainstrean journalists are too thick or too lazy to look at the facts. Instead they accept the LNP narrative.

With friends like that who knows what the polls will do?

Sensible people realise that there is no crisis, though we do need to bring the budget back to surplus within a reasonable time. After the confusion and sense of affairs out of control under Swan/Gillard, few seem to understand that finally, under Rudd/Bowen order had been restored. According to the independent umpire. Hockey has added the chaos and crisis in so far as it exists.

I’m inclined to think that Hockey/Abbott et al have fractured the basic contract with the people, that the people will not want to go back to the world of the pre-Whitlam era, which is where Trevor Cook compellingly thinks the reactionary tea party is aspiring to take us:

When they attack the so-called age of entitlement, they are really attacking the pillars of modern, Whitlamite Australia where concerns about access were more important than reducing the tax rate for business and rich individuals.

And the biggest stalking horse of all is Abbott’s efforts to get rid of Labor’s commitment to a national system of government and revert to a pre-federation style competition between increasingly impoverished states.

The intended victims of this charade are the poor and the middle class.

Abbott knows the states will be forced to cut spending – he wants them to do it.

Australia is at a turning point. And Abbott is no moderate, no centrist, not even a genuine conservative.

Perhaps the tea party utopia is best captured in this image from an anti-liberal site via Mark’s Facebook:

save the rich_10300316_320260274792507_5516613108870449871_n_500

Climate clippings 97

Climate clippings_175 This edition contains a miscellany from the absolutely central scientific issue of climate sensitivity to adaptation in Bangladesh.

1. Sense about climate sensitivity

The fourth IPCC report in 2007 estimated that the planet will warm between 2 and 4.5°C warming in response to a doubling of the amount of CO2 in the atmosphere, with a best estimate of 3°C. Since then a number of studies suggested a lower sensitivity, leading the IPCC’s fifth report to extend the range to 1.5°C at the lower end and omit a best estimate entirely.

Dana Nuccitelli reports on a new paper by Kummer & Dessler which shows that recent studies suggesting an insensitive climate are flawed. Without going into the detail they converge on a value around 3°C.

2. CO2 fertilization won’t slow global warming

Some contend that increased CO2 in the atmosphere will enhance plant growth leading to an increase in soil carbon. A study of this issue found that any such gains were offset by increased microbial activity in soils. Along the way the researchers found that soil carbon was less stable than previously thought.

3. Bangladesh uncovers the crippling cost of climate change adaptation

Bangladesh_viewimage_500

Bangladesh has found the cost of climate change adaptation quite crippling in a new report.

They are spending $1 billion a year, 6-7% of their annual budget, on climate change adaptation. Only a quarter comes from aid.

The irony of the finding will be lost on few people: the average European citizen emits as much carbon in 11 days as the average Bangladeshi in an entire year. Yet it is the government and the people of Bangladesh who are expected to pay for the escalating costs.

Within the country it is the poor who are most severely affected.

After the report Bangladesh sees climate adaptation expenditure as central to their development.

4. Deutsche Bank rules out funding for controversial Abbot Point coal terminal

Deutsche Bank:

said it would not finance an expansion without the assurance of both the Government and UNESCO that it would not damage the Great Barrier Reef.

“We observe that there is no consensus between UNESCO and the Australian Government regarding the expansion of Abbot Point,” it said.

“Since our guidance requires such a consensus as a minimum, we would not consider a financing request.”

Thanks to John Davidson for the heads-up.

5. Onshore wind cheapest form of power


In Europe, that is
according to Portugal’s EDP, which has around 24GW of generation, of which around 8.7GW is in onshore wind.

EDP-wind-estimates_cropped

CCGT is baseload gas.

John D has more detail at Climate Action 04.

The same article tells us that Keith DeLacy, former Qld Labor treasurer who would do just about anything to turn a buck, said on the front page of the Oz that renewables had “no place in a modern society”.

Meanwhile economist Jeffrey Sachs, advisor to UN secretary general on the Millennium Development Goals, is in Australia telling us that we can’t mine all that coal unless we invest in carbon capture and sequestration technology. We just need to get serious:

Put in real money, probably $20 to $30 billion I would say, minimum, to get scaled, serious demonstration programs working in China, in India, in Australia, in Canada, in the United States and to test the geology and the engineering of this technology.

Sachs is a man who thinks big!

6. EU’s energy strategy

Not surprisingly, the EU has been taking another look at its energy security strategy in view of the political instability to their east.

The EU imports over half the energy it consumes at a cost of more than €1 billion per day. Two-thirds of its gas is imported, with nearly a third coming from Russia. Half of that is transported via Ukraine.

Russia has already twice pulled the plug on gas supplies to Europe arriving via Ukraine, in 2006 and 2009.

The bottom line is that there will be a continued dependence on Russia for the foreseeable future:

The EU energy security strategy doesn’t look like it’ll take a rifle to that Russian bear just yet. But with a tweak to address vulnerability here and a spotlight on energy dependence there it may just help the EU avoid a mauling – and drive an ambitious EU 2030 climate and energy deal too.

Shale gas and nuclear energy are being left as options that member states can explore if they wish.

Reminder: Use this thread as an open thread on climate change.

A Coast to Coast odyssey – where it all started

It must be around 2 years ago now that a group of four friends and I first spoke about completing the Coast to Coast (C2C) walk across northern England.  And so here we all are, eager to get going on our C2C odyssey on 26 May, 2014!

The walk starts at the small village of St Bees on the Cumbrian coast and ends at Robin Hoods Bay on the North Sea coast.  It was devised in 1971/72 by noted English fell-walker, Alfred Wainwright and the details of the walk were published in his 1973 book – A Coast to Coast Walk (a revised edition is still in print!). Since then the C2C has achieved international popularity and around 10,000 people from all parts of the world now complete it each year.  For example, we came across a chap from the USA down in the village this-morning.  He told us that he and his 78 year-old mother are starting the walk tomorrow!  We may well see them on the track. A recent survey of long-distance walkers rated the C2C as the second-best long-distance walk in the world!

But it isn’t without it’s challenges.  It is just over 300 km long (varies with the precise route taken – there are several alternatives in a number of places, frequently a high altitude option (with expansive, spectacular views) and a low altitude, more intimate parallel option).  As well, there are plenty of hills and mountains to climb, with the total ascent required over the walk around 7,000 m.  And maybe even more important, the amount of descent is the same (assuming sea-level is the same in the Irish and North seas!).

So with these challenges in mind, we decided to complete a series of one and two-day training walks around South-east Queensland (Australia – where we all live), starting about 12 months ago.  Over this period we have walked close to 200 km as a group, mostly along the excellent National Park network of walks.  These walks culminated in a 45 km 2-day trek along the ‘Border Track’ from O’Reilly’s to Binna Burra and return. Here we are at Binna Burra  about to set out on the return journey on the second day of our walk. IMG_4615a And so on Saturday, 24th May, we all converged on Manchester Airport from various parts of the world (Rome, Paris, London), meeting at the Delice de France Café, Terminal 3.  Here we are, all looking excited in anticipation of what is to come! IMG_0159 The couple on the left are Doug and Tricia Smith, while the couple on the right are Laurie and Tricia Sheahan – both have been close family friends for nearly 40 years!  While we have had many very enjoyable experiences together, this is the first time we have engaged in an activity as enterprising as this.  But I must say that our preparatory walks together have been most enjoyable.  My wife, Nola, is a great Anglophile and I’m sure would have enjoyed many things about this trip.  But  she is not a keen long distance walker  ….. so stayed at home this time.

From Manchester, we travelled by train to Barrow-in-Furness and then up the very picturesque Cumbrian coast to St Bees.

We then spent Sunday 25th May relaxing in St Bees, readying ourselves to start our great adventure.  Opposite the Fairladies Barn, our B&B accommodation in the main street of St Bees, is the little pub …. see below.  Here, we have had lashings of home-cooked fare on the last two evenings, along with a pint or two.  Roast beef and Yorkshire Pudding, meat pies (with plenty of meat), and blackberry, apple and rhubarb pie have variously kept us (too well) fed and ready to go. IMG_0245 The C2C from west to east starts on the beach at St Bees and proceeds immediately up onto the high cliffs of the St Bees Headland.  If you were sitting in the tea-house in the building on the left in the picture below, you would see us disappearing into the distance along this high cliff-top 0n the start of our journey.  After several hours we will turn inland towards the Lake District and ultimately, the North Sea coast.  We intend to travel at a leisurely pace compared with many who complete this walk.  Our plan is to spend 20 days walking (averaging 15 km/day) and have three rest days along the way.  IMG_0231We found to our surprise that the tea-house listed a slice called ‘Australian Crunch’ among its delicacies.  It must be popular since it was sold out.  So I can’t tell you what it was like.  But the ‘Bakewell Slice’ was delicious!

My plan is to make regular posts along the way.  But I can’t promise any particular frequency since it will all depend on many factors, including internet access (or lack of it) in some of the small villages.  And there may be other activities that compete for my time along the way as well!

Antarctic images

In this post I’ve included a series of explanatory images of the Antarctic in order to assist understanding the peril we are in from changes there, and why the Antarctic is going to be central to the climate change story over the coming centuries. What happens to the grandchildren of those who are children now is the big concern. In large part these images relate to items 2-4 of Climate clippings 96.

The first shows the giant vortex of winds, the strongest for at least 1000 years, ripping around Antarctica in a tight circle:

Figure 1
Figure 1

These winds draw rain away from southern Australia, and isolate Antarctica to some extent in terms of atmospheric warming. But they also churn up the ocean, leading to deeper mixing of heat and greenhouse gases.

Both the deep and the shallow formations of the thermohaline circulation system wrap themselves around the Antarctic:

Figure 2
Figure 2

One way or another warm water is penetrating through to Antarctica. The underlying topography of Antarctica reveals much of the land lying below sea level:

Figure 3
Figure 3

The borderline between blue and green marks sea level. Warmer water is coming directly into contact with the ice sheet and chewing away at the bottom of the ice shelves which form plugs holding up vast quantities of ice in the glaciers stretching hundreds of kilometres inland. The following image shows how the continent drains:

Figure 4
Figure 4

There is concern now that West Antarctica has tipped and with East Antarctica also more vulnerable than previously thought, sea level rise of some metres is now inevitable even if we were to somehow instantly curb greenhouse emissions.

Greenland is quite a different problem. For starters the underlying topography is saucer shaped, with glaciers exiting to the sea through ‘gates’. This image shows the topography:

Figure 5
Figure 5

Greenland melts very much from the surface, so its largely a matter of meltwater penetrating, indeed plunging at times, through the surface to the rock below and glaciers speeding up. This image shows some people standing where I’d never stand:

Figure 6
Figure 6

This image shows melting covering the entire Greenland ice sheet for a few days in 2012:

Figure 7
Figure 7

The panel on the left shows a more typical summer melt pattern, which is advancing noticeably over short time frames of a few years.

In the Antarctic, this image shows surface warming over the period 1981-2007:

Figure 8
Figure 8

But with the average temperature around -39°C on the East Antarctic ice sheet, which is four kilometres high, that huge lump of ice is relatively stable. This image from NASA in 2005 shows significant perimeter surface melting around East Antarctica:

Figure 9
Figure 9

The new research sees concern that warmer sea waters may destabilise the ice further inland than previously thought. Match the red blobs on East Antarctica with the drainage map at Figure 4.

Of some some concern and some comfort is the Andrill Project which found that “the West Antarctic ice sheet has collapsed and regrown over 60 times in the past few million years”. This image shows what happened about a million years ago over a 12,000 year period:

Figure 10
Figure 10

Concern because the Andrill research shows what can happen with mild orbital forcing (the Milankovitch cycles) as the main driver. I understand that CO2 concentration back then was only 400 to 450 ppm, which is where we now, implying that we are already committed to wasting the West Antarctica ice sheet. There is some comfort, however, that a change in the orbital forcing, which is far weaker than what we are doing now, arrested the melt in West Antarctica and brought the ice sheet back again. There was no tipping point which saw the whole East Antarctic sheet disappear.

For perspective I’ll post one of my favourites, a graph from David Archer in 2006 showing the broad relationship between temperature and sea level:

Figure 11
Figure 11

Do not connect the dots with straight lines. Most importantly, I think we now stand at the upper level of a 2°C interval where the sea level did not change much. The NH continental ice sheets had disappeared and the remaining ones – Antarctica, Greenland and the Arctic – were not seriously in play. Even now the main sources of sea level rise lie elsewhere. This table (13.1 from the IPCC5 WG1 Technical Summary) shows what’s happening:

Figure 12
Figure 12

That’s hard to read, so here are the figures for the average annual expansion for 1993-2010:

    Thermal expansion – 1.1mm

    Glaciers except Greenland and Antarctica – 0.76mm

    Glaciers in Greenland – 0.10mm

    Greenland ice sheet – 0.33mm

    Antarctic ice sheet – 0.27mm

With 4-5°C we can expect complete deglaciation and 75 to 80m sea level rise, made up of East Antarctica 59m, Greenland 6-7m, West Antarctica 5-6m, other glaciers and ice caps about 0.5m and thermal expansion, I don’t know, but I think in single figures. Greenland and Antarctica are accelerating rapidly and some time this century will become the top two contributors. These graphs from Skeptical Science are instructive:

Figure 13
Figure 13

Greenland and West Antarctica are in a death spiral of accelerating ice sheet decay. It’s happened 60 or more time before in recent paleo history. West Antarctica, being more vulnerable may overtake Greenland.

One could say from this that East Antarctica is not yet in play, but science seems to suggest it is not far away.

When ice sheet decay gets going Hansen sees it as possibly progressing in geometric fashion, producing a curve like this:

Figure 14
Figure 14

My thinking is that East Antarctica will tip sometime in the next decade, and that ice sheets will decay from there in a pattern that is more exponential than linear. Hansen’s scenario, which he puts forward as a serious possibility, does not look crazy.

I suspect that we are already committed to double digit sea level rise, and there’s not a thing we can do to prevent it; the question is when will it happen? We can only adapt and minimise.

I suspect also that things will go seriously pear-shaped during the latter part of this century. Pity our grandchildren’s grandchildren.

Update: There is a short ABC video news item about the Antarctic ice melt doubling since the last survey. At the end it says the process could take 1000 years. For a complete melt that would be lightning fast – 7.5 to 8 metres per century, or a metre every 12-13 years. We are pushing the system more than 10 times faster than it has ever been pushed before.

See also Gareth Renownden Goodbye coastline: we are beyond the point of no return.

Climate change, sustainability, plus sundry other stuff