Tag Archives: Temperature

Climate clippings 107

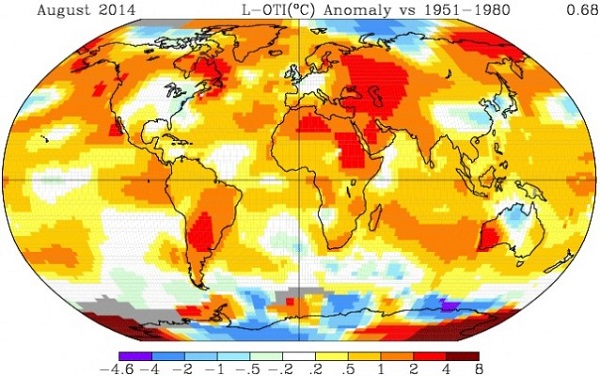
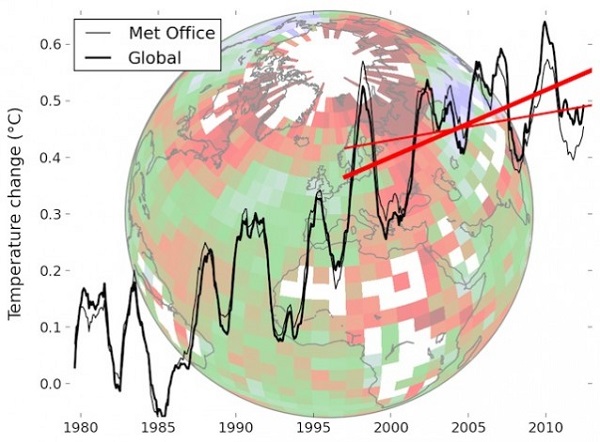
1. No more pauses in global warming

Temperatures are likely to rise dynamically for the rest of the century, according to two separate studies.

Masahiro Watanabe of the University of Tokyo colleagues found that over the past three decades natural influences are diminishing.

In the 1980s, natural variability accounted for almost half of the temperature changes seen. That fell to 38 per cent in the 1990s and just 27 per cent in the 2000s.

The implication is that temperature rises will respond more directly to emissions with fewer pauses.

Matthew England and associates used 31 climate models to chart future temperatures. He found that if emissions keep rising the chances of a pause of 10 years or more fall to practically zero. If emissions peak by 2040 we might get a pause by the end of the century.

If we wait until 2040 for peak emissions we’ll be cooked.

2. Rockefeller family moves from fossil fuels to clean energy

The Rockefeller family is turning its back on the industry that made it its vast fortune.

As more than 120 heads of state gather in New York for a UN summit on climate change, the Rockefeller Brothers Fund is pledging to move $50 billion worth of investment in fossil fuels into clean energy.

3. War and Peace revisited

At Fair Green Planet Val has reproduced her talk at the Australian Climate Action Summit 2014. It’s about organisational form in relation to climate change action and sustainability. Val suggests we need to change from forms based on competition, hierarchy and exploitation to forms based on co-operation, egalitarianism and sustainability:

From both my research and my lived experience, it seems clear to me that the approach we need to address climate change will not be produced by the hierarchical, top down, unequal organisations that are dominant in society today – but rather by an approach like this:

team earth

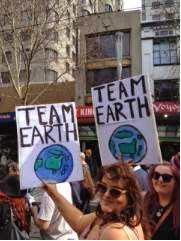
These “Team Earth” posters were of course produced in response to Tony Abbott’s “Team Australia”. The posters express to me the values we really need to address climate change: a recognition that we’re all in it together, and an inclusive approach.

We need:

to go beyond climate change and live in sustainable communities – communities that are flatter, networked, egalitarian and inclusive, and recognise themselves as part of an ecosystem.

In other words, we need to change ourselves.

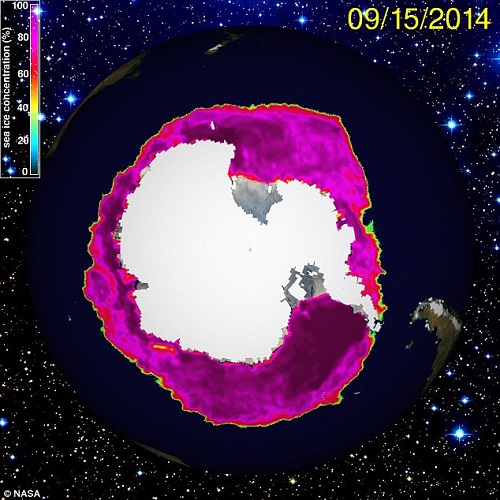
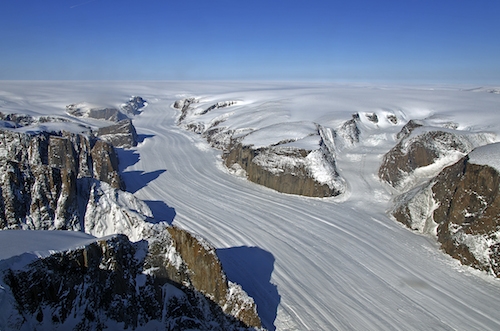
4. Arctic sea ice report

Arctic sea ice melting has now reached its maximum extent. This year was almost exactly the same as 2013, and the sixth lowest on record.

Sea ice Sept_cropped_600

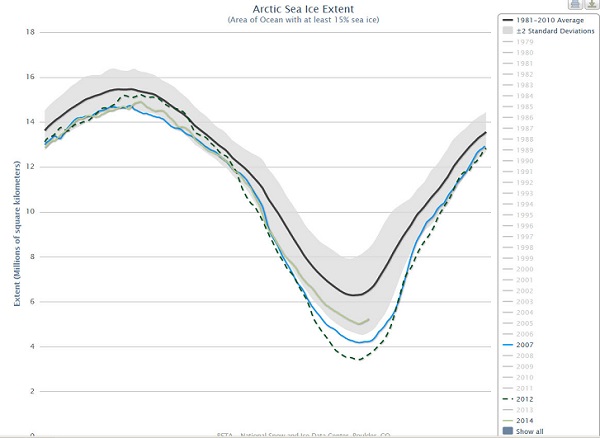
The black line is the 1981-2010 average, the dotted line the 2012 record and the blue line the former 2007 record. Shading represents plus or minus 2 standard deviations.

Volume was also up a bit but still in trend decline.

What this masks is a continued decline in the proportion of older, thicker ice. An increasing proportion is first year ice. At Carbon Brief:

During the 1980s or 1990s, in an average year, around 54 to 58 per cent of ice in the Arctic would be first-year ice. Last year it was 77 per cent.

5. New York UN meeting

Last week some 125 leaders met with the UN Secretary General and each other in New York to indicate what their post 2020 emissions reduction targets might be. I reported on the outcomes here, but it seems that readers of this blog are put off by titles like the one I used.

Problem is, the bad news is getting worse and is not being addressed sufficiently by world leaders. Emissions increased by 2.5% in 2013. Every year the emissions increase the harder the problem becomes. It’s not a case that action is just delayed; we are using up a carbon budget that by some estimates is already in the red.

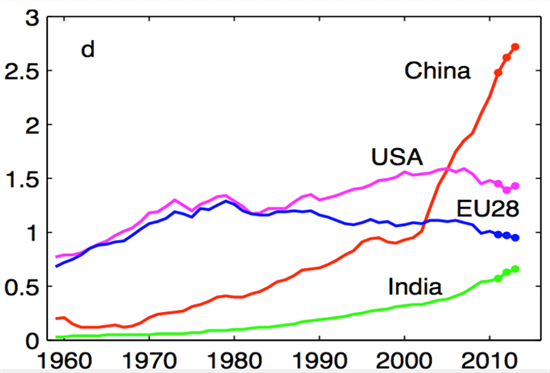
Of the major emitters only the EU was specific, nominating 40% by 2030, subject to confirmation. Not enough. There were indications that China will give concrete numbers when formal proposals are submitted next March. However, their current rate of increase is quite dramatic, as this graph shows:

gcp-country-emissions-line_550x373.jpg

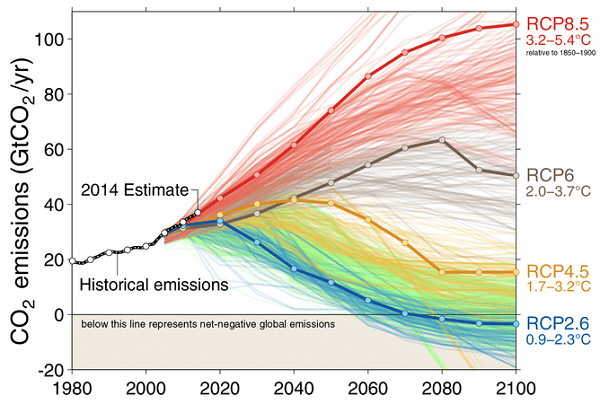
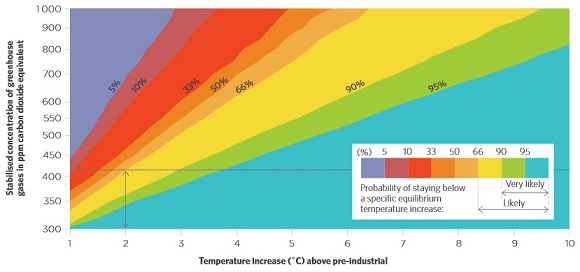
My expectation is that at best, when the bids are in, our path will match the RCP4.5 scenario (the scenarios are numbered according to the climate forcing pertaining to CO2 levels with the forcing expressed in watts per square metre).

84jyvk7k-1411262594_600

A new report puts the situation this way:

Nevertheless, the report said there is still a “gigatonne gap” between governments’ current carbon-reduction pledges and what will be needed to limit overall warming to 2C.

Delivering on current policies would only succeed in reining warming back from 4C to 3C, it predicted. The United Nations’ New York 2014 and Paris 2015 climate summits will be crucial in securing an improved deal, the report said. (Emphasis added)

Indeed. In New York on our behalf Ms J Bishop said the Government would consider what post-2020 emissions might be, but consistent with the need for economic growth. I think in her mind this means banking on cheap coal as our dominant power source.

For another view, see Christine Milne at the National Press Club:

I believe that Australia should put on the table for the 2015 negotiations a trajectory of 40 to 60 per cent below 2000 levels by 2030 and net carbon zero by 2050.

Climate clippings 106

1. Abbott adviser warns of threat of ‘global cooling’

Nevertheless with the certainty only possessed by fools, the Abbott government’s chief business adviser, Maurice Newman, has warned that Australia is ill prepared for global cooling owing to widespread “warming propaganda” in his latest critique of mainstream climate science.

The suggestion is that temperature change is due to changes in solar activity, cosmic rays and stuff. The science is heading in the opposite direction.

“The sun doesn’t have as much influence on the climate as we previously thought, the latest estimates are that it explains only 5% of the warming over the last 150 years,” he said.

How can the government be advised by someone who is so ill-informed about arguably the biggest single influence on business conditions over the next century.

2. August hottest ever

We’ve just had the hottest August globally since records began being kept in 1880, according to NASA. The year to date has been the fourth hottest on record. Hot years usually coincide with an El Niño either in the year concerned or the previous year. An El Niño has not yet arrived but does look likely according to the latest information.

NASA_ 2014_Ag_600

It has been especially hot in West Antarctica. Bear that in mind when you see stories of record sea ice around Antarctica:

seaice_2014_Ag_500

This is not incompatible with global warming and could in fact be caused by it. Melting ice produces cold water, and the tightening wind pattern tend to blow the ice further north.

There is no information as yet on ice volume.

3. Australian Climate Action Summit 2014

The Australian Climate Action Summit 2014 is on this weekend. Since my life is governed by work, the weather and medical appointments I am unable to go.

On Sunday there will be a People’s Climate March, organised by an outfit called Avaaz. Marches will be organised all around the world, and indeed, all around Australia, including, for example Mt Isa and the Gold Coast. If you click on Brisbane you get the Summit, but if you click on the Summit you don’t get a march. So if there is a march in Brisbane, I can guess where but I’d also need to guess when.

The march is meant to impress the leaders gathering in New York on Tuesday 23 September. That’s the UN Summit Tony Abbott will not attend although he’ll be in New York on Wednesday.

4. Surviving in hot, acidic oceans

I think this is a good news story.

More than 90% of the extra heat in global warming ends up in the oceans, as does 25% of the CO2 we create, which makes the oceans more acidic. Shell-making organisms such as plankton are expected to be in trouble. The good news is that it seems one species of plankton, the Emiliania huxleyi, can survive the changes underway.

5. Climate Council report on sea level

The Climate Council has taken another look at climate change and coastal flooding. The focus is on 1.1 metres sea level rise by 2100, all too possible if West Antarctica is in play, as it seems to be.

We are told that the frequency of flooding events can treble for every 10 cm of sea level rise. The risk multiplier depends where you are. In Sydney, Bundaberg and Hobart, for example a current 1 in 100 year event now could be happening every day by 2100. In Adelaide, the least at risk city, it would be only once every year.

At risk we have $87 billion worth of commercial and light industrial buildings, $72 billion worth of homes and $67 billion worth of roads and rail infrastructure.

6. Capitalism v The Climate

Joe Romm tells us about Naomi Klein’s new book, This Changes Everything: Capitalism Vs. The Climate. Klein, he says, makes three essential points:

1. Because we have ignored the increasingly urgent warnings and pleas for action from climate scientists for a quarter century (!) now, the incremental or evolutionary paths to avert catastrophic global warming that we might have been able to take in the past are closed to us.

2. Humanity faces a stark choice as a result: The end of civilization as we know it or the end of capitalism as we know it.

3. Choosing “unregulated capitalism” over human civilization would be a “morally monstrous” choice — and so the winning message for the climate movement is a moral one.

The time for ‘evolutionary’ strategies is long past. Now only ‘revolutionary’ strategies will get us there. Unregulated capitalism is a Ponzi scheme, which must collapse. The real choice facing us is a moral one.

Unchecked capitalism is immoral and will destroy civilisation as we know it. Just what Klein says we should do will be covered by Romm in a subsequent post.

Climate clippings 104

This edition begins with the weather and ends with a sad tale of revenge and tribalism as the basis for climate policy.

1. June the hottest on record

When we have some cooler than normal weather people are apt to say “So much for global warming!” They should realise how small a part of the globe we are.

The warmest May on record for the planet has been followed by the warmest June:

June 2014_201406-600

In fact June was the highest departure from average for any month on record.

The last below-average global temperature for any month was February 1985. The last below average June was in 1975 when Gough Whitlam was PM!

2. El Niño still favoured

The majority of models still favour a spring El Niño:

Warming in the tropical Pacific Ocean since the beginning of 2014 has primed the climate system for an El Niño in 2014, although an atmospheric response is yet to be observed. As a result, the transition towards El Niño conditions has slowed in recent weeks. While five out of eight climate models surveyed by the Bureau suggest El Niño will become established by October, all have eased their strength over the past few months. Three models suggest an El Niño will not occur in 2014, while another indicates only a brief period of El Niño-like conditions.

3. Temperatures poised to rise rapidly

El Niño years are often associated with a higher than average temperature rise. However, there’s another reason temperatures may be about to rise. You may recall that around 93% of the extra global warming goes into the ocean and only 2.3% into the atmosphere:

GW_Components_570

In recent years the trade winds have speeded up causing deep mixing in the ocean, taking warm water deeper displacing cooler water which rises to the surface to be warmed. Sooner or later this will stabilise, with more heat going into the atmosphere.

The article also points out the recent correction of the Hadley Centre temperature record, adding in an estimate for the polar regions, where there are no weather stations. This correction virtually eliminates the famous ‘pause’. The heavy lines show the corrected data:

Cowtan-600

4. Onshore wind is now the cheapest form of new energy in Denmark

6250146831_ffa2f45d46_b-500

A new analysis from the government of Denmark found that wind power is by far the cheapest new form of electricity in the country. New onshore wind plants coming online in 2016 will provide energy for about half the price of coal and natural gas plants, according to the Danish Energy Agency (DEA), and will cost around five cents per kilowatt hour.

5. Abbott bets the house on coal

Meanwhile our visionary PM bets the house on coal as the world price is collapsing and countries turn to renewables.

The price for thermal coal has plunged more than 10 per cent in the last two months as the presumed major customers – China and India – make it clear that renewable energy is offering a competitive alternative to coal and gas.

The current spot market has been below the cost of production.

China may cease to import coal in a few years. The Europeans are talking about ramping up targets for emission reductions, energy efficiency and renewable energy. The Indians are

building of “mega” capacity solar farms, off-grid solar pumps for irrigators, solar installations over canals, cuts in tariffs for solar components and a doubling of the tax on coal – has been followed by an announcement that the country will look to expand a “rent-a-roof” program from solar installations initially begun in Gujarat, the home state of new PM Narendra Modi, who has promised a “saffron revolution” of solar power.

Tata Power is providing interest free loans up to $4,000 for rooftop solar.

Bloomberg New Energy Finance last week predicted solar would beat coal plants on costs by 2020. Chile has announced a whole series of large scale solar plants. On and on it goes.

Here in Sydney there was concern at the Clean Energy Week conference that Abbott can cripple renewables by doing nothing. According to one speaker

even if the 41,000GWh target was retained, and long term certainty provided, the removal of the carbon price will make it difficult to obtain financing for wind and solar farms from financial institutions.

That’s because the carbon price and the RET were designed to work together. If the carbon price is removed, then there is a massive shortfall in revenue when the certificates issued under the RET expire in 2030…

John D has been calling it but here’s a dramatic graph showing how large scale investment has stopped in its tracks:

bnef-finance-s-590x329

6. Tribal wars and revenge

I couldn’t find a decent review of Ian Chubb’s excellent book Power failure, which traces climate policy in Australia from before the 2007 election to the installation of the Abbott government. The link in the heading is to a revealing interview with the author by The Fifth Estate. Chubb:

“[Climate change denial] is a cultural issue for the Coalition. It’s nothing to do with rationality or reason or the future or business – it’s tribal. While this government is in power we can’t recreate the consensus.

“For this government burning coal to make electricity is the equivalent to eating red meat – if you don’t, you’re a sissy. So this government will never have sympathy for making renewable energy – only sissies do that. The government has attempted to shut down everything to do with renewable energy.”

He the goes on to talk about revenge, tribalism and well-flung mud.

He describes the current policy situation as current policy situation as a “ridiculous and expensive mess”. Two things might change it. One is leadership from the US. The other is that nasty things may have to happen from the climate itself.

My sense is that the damage to confidence wrought by this mob is such that a change of government with new policies may not be enough. We need the Tea Party to get real before confidence can be restored.

I need to say more about Chubb’s book which is clear-eyed about the strengths and weaknesses of both Rudd and Gillard. Anyone wondering why some of Rudd’s colleagues thought he had to go should read this extract in The Age.

The game is up

In the post A choice of catastrophes: the IPCC budget approach I explained the socalled ‘carbon budget approach’ in some detail. In general terms:

    In a warming world what matters is the total quantum of CO2 in the atmosphere. The ‘climate budget approach’ identifies the total anthropogenic CO2 emitted to cause warming of 2°C. For a 66% chance of staying under 2°C the total CO2 emitted must not exceed 1000Gt, according to calculations done by Malte Meinshausen and others back in 2009. The later we leave cutting the harder we have to cut.

Rahmstorf’s budget was about 1000Gt of CO2 or about 1500GT of CO2 equivalent with other greenhouse gases for a 25% chance of staying within 2°C. Then

    as Giles Parkinson reports, the carbon budget figures have taken a haircut to become 800Gt for a 66% chance of 2°C when “accounting for non-CO2 forcings”. Problem is we’d already used up 543Gt of the budget by 2011.

David Spratt now tells it straight: Continue reading The game is up

Climate clippings 98

This edition includes important updates on Greenland and Antarctica, global food supply, CSIRO cuts, CO2 levels moving decisively past 400 ppm and CO2 compared to global temperature rise.

1. Greenland may melt faster than expected

You may recall from the post Arctic images I included an image of the underlying topography of Greenland (Figure 5). It is saucer-like with large areas inland below sea level. The glaciers tend to drain through narrow gateways in the external rim. So they tend to be narrow and fast-flowing:

Glacier_assets-climatecentral-org-images-uploads-news-5_16_14_Andrea_Greenlandglacier-500x331

The mouths of most glaciers are melting from contact with warmer seas. It was felt that as this process continued the ice would lose contact with the water, slowing the melting.

New studies of the topography have shown that many of these channels are below sea level.

Valleys underlying many of the glaciers stay below sea level and extend much farther inland than previously suggested, so warm ocean currents that have migrated northward with the changing climate could eat away at the ice for much longer than current climate models suggest. “It will take much longer for these glaciers to lose contact with the ocean,” study author Mathieu Morlighem, of the University of California, Irvine, told Climate Central.

2. Melting Antarctica could devastate global food supply

A new report is the “first to factor in the effects of the slow-motion collapse of the Western Antarctica ice sheet on future food security.”

About time, I’d say.

The report acknowledges recent findings that that the retreat of the Western Antarctica ice sheet was unstoppable – and could lead to sea-level rise of up to 4 metres over the coming centuries.

“That sea-level rise would take out half of Bangladesh and mostly wipe out productive rice regions in Vietnam,” Nelson told The Guardian. “It would have a major effect on Egyptian agricultural areas.”

“A sea level rise of 3 meters (10 feet) over the next 100 years is much more likely than the IPCC thought possible,” the report said.

In terms of absolute land loss, China would be at risk of losing more than 3 million hectares (7.4 million acres). Vietnam, India, Bangladesh, and Myanmar could lose more than 1 million hectares (2.5 million acres), the report said.

The report recommends a radical increase in expenditure on agricultural research, which has been in decline everywhere over recent decades.

3. CSIRO cuts

The federal government cut CSIRO’s funding by $111 million over four years, which will result in 500 job cuts.

Dr Borgas [president of the CSIRO Staff Association] said a plan to move the Aspendale Laboratories to the organisation’s larger site in Clayton had been previously discussed but had come to nothing.

He said it was unclear whether the relocation would reduce the research performed by the 130 staff, which includes ice core analysis, air quality and pollution research and climate and atmospheric modelling.

Most countries planning for a future increase their scientific research funding.

4. CO2 levels decisively pass 400 ppm

During April all 12 World Meteorological Organisation northern hemisphere monitoring stations passed the 400 ppm mark, the first time ever. This is how such a level compares to the 800,000 year ice core record:

assets-climatecentral-org-images-uploads-news-5_2_13_news_andrew_co2800000yrs-500x282

When was it last this high? Possibly 15 million years ago, when it was warmer and there wasn’t much ice around.

“This was a time when global temperatures were substantially warmer than today, and there was very little ice around anywhere on the planet. And so sea level was considerably higher — around 100 feet [30 metres] higher — than it is today,” said Pennsylvania State University climate scientist Michael Mann, in an email conversation. “It is for this reason that some climate scientists, like James Hansen, have argued that even current-day CO2 levels are too high. There is the possibility that we’ve already breached the threshold of truly dangerous human influence on our climate and planet.”

5. Global temperature and CO2

I came across this graph from the NOAA National Climatic Data Center plotting CO2 levels against temperature rise. While correlation does not mean causation there is simply no alternative explanation.

assets-climatecentral-org-images-uploads-gallery-TVM-Global_Temp_and_CO2_web-600

If you take out 1998, which can be regarded as an outlier, the socalled ‘pause’ is only apparent from 2005, which is too short a time to mean anything.

There is another view which sees temperature responding in step-wise fashion. On that basis we may be due for another step, and with an El Niño likely…

Here’s one showing the ten warmest years on record, all since 1998:

assets-climatecentral-org-images-uploads-gallery-climate-matters-GlobalRecapRanking_sm-400x225

Reminder: Use this thread as an open thread on climate change.

Extreme weather

Ita_5378150-3x2-300As Cyclone Ita bears down on the coast of Far North Queensland I was reminded of the post I drafted in late February on extreme weather. Ita is rated as category 4, hence severe. On the upside few people live in the expected path. On the downside the people who do are not likely to get much help from the outside world.

The incidence of cyclones is not expected to increase with climate change, although I understand the story could be different in the Caribbean and the NW West Pacific. However, we are likely to get more severe cyclones and they may be more intense.

Here’s the post as I wrote it.

This summer, Australians again endured record-breaking, extreme heatwaves and hot weather. My daughter in Adelaide, for example, experienced a record 13 days of 40°C-plus maximums. The Climate Council’s latest report Heatwaves: Hotter, Longer, More Often came up with four key findings:

First, climate change is already increasing the likelihood and severity of heatwaves across Australia. Second, heatwaves have widespread impacts including increased deaths, reduced workplace productivity, damage to infrastructure such as transport and electricity systems, mortality of heat-sensitive plants and animals, and stress on agricultural systems. Third, record hot days and heatwaves are expected to increase further in the future. And finally, limiting future increase in heatwave activity requires urgent and deep cuts to greenhouse-gas emissions.(Emphasis added)

While the 2009 Black Saturday bushfires killed more than 170 people, the preceding heatwave killed double this figure. In fact heatwaves kill more Australians than any other natural disaster, a fact largely unremarked. The following graph plots 2009 deaths against temperature and the 2004-08 average.

Black Saturday deaths_cropped_550

According to the report it has been estimated that heatwaves could cause an additional 6214 deaths in Victoria alone by 2050.

Adelaide’s heatwaves are an average 2.5°C hotter than they were half a century ago, and peak heat days are 4.5°C hotter.

Hot days, previously considered to be “once-in-20-years” occurrences, will start to happen every two to five years in Australia by mid-century.

At the end of the report they return to their constant theme – this is the critical decade in which to take action.

Meanwhile in Toronto where my sister lives they had an ice storm around Christmas and have been living in below zero temperatures ever since (time of writing, 19 February). The snow shovelled from their driveway doesn’t melt, so the pile goes up and up and up. Of the cities listed on the weather page of our local rag only Montreal has been consistently colder.

(Update: I think the cold spell lasted at least another month.)

At the same time weather historian Christopher C Burt blogged about record warmth in Alaska.

He shows an amazing map of the forecast for February 1st at the end of the post. It’s stunning, showing the Northern Hemisphere weather split by a stream of warm air directly across the North Pole:

polarsplit_450

There is a related post at Dr Jeff Masters’ Wunderblog he says:

The cold air flowing out of the Arctic into the eastern half of the U.S. is being replaced by warm air surging northwards over Alaska and the North Atlantic east of Greenland. The warmth in Alaska the past three days has been particularly astonishing, with Alaska observing its all-time warmest January temperature of 62°[F] on Monday 1/27 at the Port Alsworth Climate Reference Network station, according to Rick Thoman of NWS Fairbanks. This ties the January state record set at Petersburg on January 16, 1981. Port Alsworth is about 160 miles southwest of Anchorage.

Nome, Alaska recorded a high of 51°F [10.5°C] on Monday. This was 38°[F] above average, and the warmest temperature ever observed in any November through March in Nome since record keeping began in 1907. (Emphasis added)

I think 38°F is about 21°C.

Elsewhere I’ve read that the US and Canada were 5°C colder than the 1951-1980 base in December, while north-eastern Europe and Siberia were 9°C warmer. Berlin and Moscow seem rather balmier than usual.

We are normally told that the jet stream has slowed down but for a time in February it speeded up, while being stuck in one place. The effect of this was to fling low pressure systems at the UK, where they experienced record floods.

Back in Oz again, much of the country is in severe drought, although, ironically, the grand tour by Abbott and Barnaby Joyce into the drought areas was interrupted by rain. Of course, one dump of rain doesn’t necessarily break a drought and the prospect for the coming 2014-15 summer is 75% stacked in favour of an El Niño. More records could be broken, including global average surface temperatures.

During this critical period of necessary climate action the Abbott government has appointed a climate denier Dick Warburton to head up the review of the Renewable Energy Target.

We live in interesting times.

PS One of my favourites from the archives is Remembering the floods.

State of the Climate, 2014

Front page_cropped

CSIRO and the BOM have released their State of the Climate 2014 report. Pretty much the same story you’ve heard before, only a bit worse.

There’s a good summary at the special BOM site, where you can download the report. Other than that Climate Citizen has perhaps the best summary.

Graham Readfearn at Planet Oz riffs off the Dorothea Mackellar theme of a “sunburnt country” of “droughts and flooding rains”.

At Radio National’s PM Mark Colvin interviewed CSIRO’s Dr Penny Whetton.

At The Conversation Professor Neville Nicholls emphasises rising heatwaves and fires. Sophie Vorrath has more at RenewEconomy.

I’ll comment on a few sundry aspects.

Level of greenhouse gases

We are told that the global mean for CO2 in 2013 was 395 ppm, or “likely the highest level in at least 2 million years”. Back in the 2012 report the figure of 390 ppm for 2011 was described as “a level unprecedented in the past 800,000 years”. David Spratt at Climate Code Red added a corrective addendum “that should be 15 million years.”

Spratt referenced the work of Aradhna Tripati:

The last time carbon dioxide levels were apparently as high as they are today — and were sustained at those levels — global temperatures were 5 to 10 degrees Fahrenheit [DS: 3 to 6 degrees Celsius] higher than they are today, the sea level was approximately 75 to 120 feet [BB: 23 to 36 metres] higher than today, there was no permanent sea ice cap in the Arctic and very little ice on Antarctica and Greenland.

I’m amazed at how often these reports understate the gravity of the situation, presumably for fear of being written off as alarmist.

The report usefully adds the other main greenhouse gases to give a CO2 equivalence figure:

fig13_600

Please note the nitrous oxide and synthetic greenhouse gases are given in parts per billion.

In terms of CO2 equivalence we are now the 480 ppm. We should be red alerts everywhere and an emergency meeting of the G20, or something. The sad fact is that no policy agenda adopted by a political party has aspired to a safe climate. In fact the Garnaut Report and the Clean Energy Future Package legislated by Labor, the Greens and the indies, only ever aspired to 450 or 550 ppm CO2e. James Hansen in nominating 350 ppm as an initial target was very clear that this needed to assume net zero for the other greenhouse gases. What we are committed to now is a very unsafe climate as the effects play out in the short, mid and longer term.

Abbott was going to leave climate change off the forthcoming G20 agenda for Brisbane until the Americans complained.

Prospective temperature increases

Temperatures are projected to rise by 0.6 to 1.5°C by 2030 compared to the climate of 1980 to 1999. Warming by 2070 is projected to be 1.0 to 2.5°C for low greenhouse gas emissions and 2.2 to 5.0°C for high emissions.

We’ll achieve the upper bound if we continue as we are; the lower bound lacks credibility. To the ranges given we need to add 0.6°C in order to obtain the values for change since pre-industrial.

Again, we are clearly heading for dangerous climate change.

At time of writing there was a short piece in New Scientist citing three recent studies which indicate that climate sensitivity may have been under-estimated. Drew Shindell of NASA GISS:

“Sensitivity is not down at the low end,” Shindell says. “We can’t take any solace from warming being slower of late.”

That means we must cut our emissions fast, he says, or the planet could warm by 6°C by 2100.

Warming of 4°C is usually given as the level where civilisation as we know it comes into play. For Australia in a 4°C world, see Gabrielle Kuiper at Climate Code Red.

Hot days and heat waves

This graph shows the incidence of days in a year when the temperature is in the hottest 1% relative to 1910-2013:

fig7_600

Graham Readfearn points out:

Starting from 1910 when Australia’s records start, it took 31 years for the country to rack up 28 days hot enough to fall into that top one per cent.

2013, however, managed to deliver this same number of extremely hot days in a single year.

Precipitation changes

The following map shows the rainfall variation in deciles since 1995-1996 for the northern wet season of October to April:

fig5_600

The next map shows the rainfall variation in deciles since 1995-1996 for the southern wet season of April to November:

fig6_600

I believe that Sydney, which has dominant autumn/early winter rainfall, sits on the border between the summer and winter rainfall zones.

Clear patterns of change are becoming obvious. Apart from southern areas there is distinct drying in large tracts of Queensland, especially in winter.

This is disturbing:

The reduction in rainfall is amplified in streamflow in our rivers and streams. In the far southwest, streamflow has declined by more than 50 per cent since the mid-1970s. In the far southeast, streamflow during the 1997–2009 Millennium Drought was around half the long-term average.

Could be that we’ll increasingly have to rely on damaging floods to fill our dams.

Conclusion

There’s more, of course, including the prospect of losing our reef ecosystems.

Climate change is upon us.

Real clothes for the emperor

“When I look at this [CO2] data, the trend is perfectly in line with a temperature increase of 6 degrees Celsius, which would have devastating consequences for the planet.” Fatih Birol, IEA chief economist

That’s one of the favourite quotes by Professor Kevin Anderson of Manchester University and the Tyndall Centre (personal website here) who, like James Hansen in the US and John Schellnhuber in Germany, is a leading climate scientist who speaks plainly about the dangers of global warming and the situation we’re in. Much of his important work seems to have been done with Alice Bows, now Bows-Larkin. In this piece I’ll refer to “he” or “they” depending on my perception of the source.

Real clothes for the emperor was the title of a talk Anderson gave to unionists in June 2013 (slides here).

Their basic point is that no real progress has been made since the Rio Summit in 1992 from which international action flowed through the agency of the UNFCCC and the IPCC. Policy makers in nations with ostensible targets seriously fudge the game so that economic growth is not inconvenienced.

Another favourite quote of theirs is:

“… dangerous climate change can only be avoided if economic growth is exchanged, at least temporarily [until low carbon energy supply is widespread], for a period of planned austerity within Annex 1 nations…” – Anderson and Bows, 2011

I’ll proceed by stating their main summary points in turn followed by a brief explanation. Continue reading Real clothes for the emperor

Climate clippings 89

Climate clippings_175
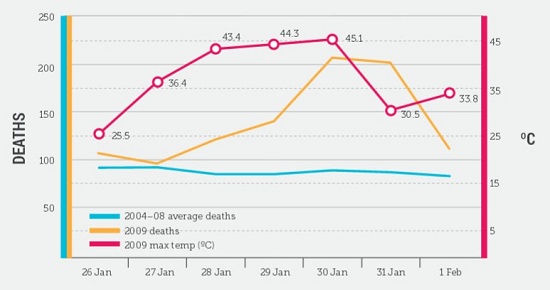
These posts are intended to share information and ideas about climate change and hence act as a roundtable for readers to contribute items of interest. Again, I do not want to spend time in comments rehashing whether human activity causes climate change.

This edition is a mixture of science and implementation issues that found me rather than I found them. A couple came from Mark’s Facebook. The last item was drawn to my attention by John D.

1. Electric tents

If you want a tent for the holiday period that stands out from the pack and generates enough electricity to power computers, phones, cameras and loud speakers then
Bang Bang Tents is for you.

Bang Bang tents_cropped_500 Continue reading Climate clippings 89

Climate clippings 83

Climate clippings_175These posts are intended to share information and ideas about climate change and hence act as an open thread. Again I do not want to spend time in comments rehashing whether human activity causes climate change.

This edition contains items, exclusively, I think, in climate science and impacts. The thread is meant to function also as a roundtable to share information and ideas.

1. Climate change picked the crops we eat today

The New Scientist carries a story about how some cereals we know today were changed by the climate as we came out of the last ice age. Researchers at the University of Sheffield, UK took seeds of precursors of modern wheat and barley found with human remains in a 23,000-year-old archaeological site in Israel. They grew these together with four wild grass species that aren’t eaten today, but were also known to grow in the region at that time, and grew them under conditions replicating levels of CO2 then and also the higher levels when farming first arose 10,000 years ago.

All the plants grew larger under the higher levels of CO2, but the relatives of wheat and barley grew twice as large and produced double the seeds. This suggests the species are especially sensitive to high levels of CO2, making them the best choice for cultivation after the last ice age.

The team plan to look at whether other food staples around the world are similarly affected by elevated CO2 levels, for example millet grown in Asia and maize in North America. They also plan to compare the effects of CO2 on legumes such as peas. Continue reading Climate clippings 83

Climate clippings 73

In this edition I’ve stuck to scientific articles, and, incidentally have used a couple (items 3 and 4) from stuff I gathered around this time last year when I thought I might be launching a new blog. For reasons we won’t go into it didn’t happen at that time.

1. Arctic ice watch

While we were on sabbatical last year the northern cryosphere had an exciting time. There was a giant storm in the Arctic ocean, Greenland surface melt covered virtually the whole ice sheet and all sorts of records were broken in the Arctic summer sea ice melt. I’m hoping to do an update to catch us up, but follow this link to see a dramatic animation of Arctic sea ice volume loss since 1979. I’ve posted this image to show how far we’ve come:

volume-comparison-1979-2012-v4

You can monitor Arctic sea ice extent on the NSIDC site. This image is a screenshot from the interactive graph on that page showing the way summer sea ice is sagging:

Sea ice extent_cropped_580 Continue reading Climate clippings 73

Global heating update

Little ice age_130421152401-270

Last month we had a look at the Bigger, better, new hockey stick from a study by Marcott et al. Since then Skeptical Science has a post on the phoney skeptical/denialist critique of the study. We now have a new study, Continental-scale temperature variability during the past two millennia, by 78 scientists from 24 nations analyzing climate data from tree rings, pollen, cave formations, ice cores, lake and ocean sediments, and historical records from around the world published in the journal Nature Geoscience. The study found:

There were no globally synchronous multi-decadal warm or cold intervals that define a worldwide Medieval Warm Period or Little Ice Age, but all reconstructions show generally cold conditions between ad 1580 and 1880, punctuated in some regions by warm decades during the eighteenth century.

The real interest was in the regional variations on a continental scale. Temperatures were identified for the Arctic, North America, South America, Europe, Asia, Australasia and the Antarctic. There was insufficient data for Africa. Continue reading Global heating update